In ant colony optimization (ACO), pheromone intensity is a number representing the strength of a simulated signal on a path. Ants use it to influence their next move: a stronger trail makes a path more attractive, alongside other information such as distance. section 6.1 section 6.7
The idea comes from real ants, which leave chemical signals as they move. On a short route, ants can make trips more quickly and reinforce the trail more often. Other ants follow that stronger signal, creating a snowball effect. section 6.1
Figure 6.2 Asymmetric bridge experiment
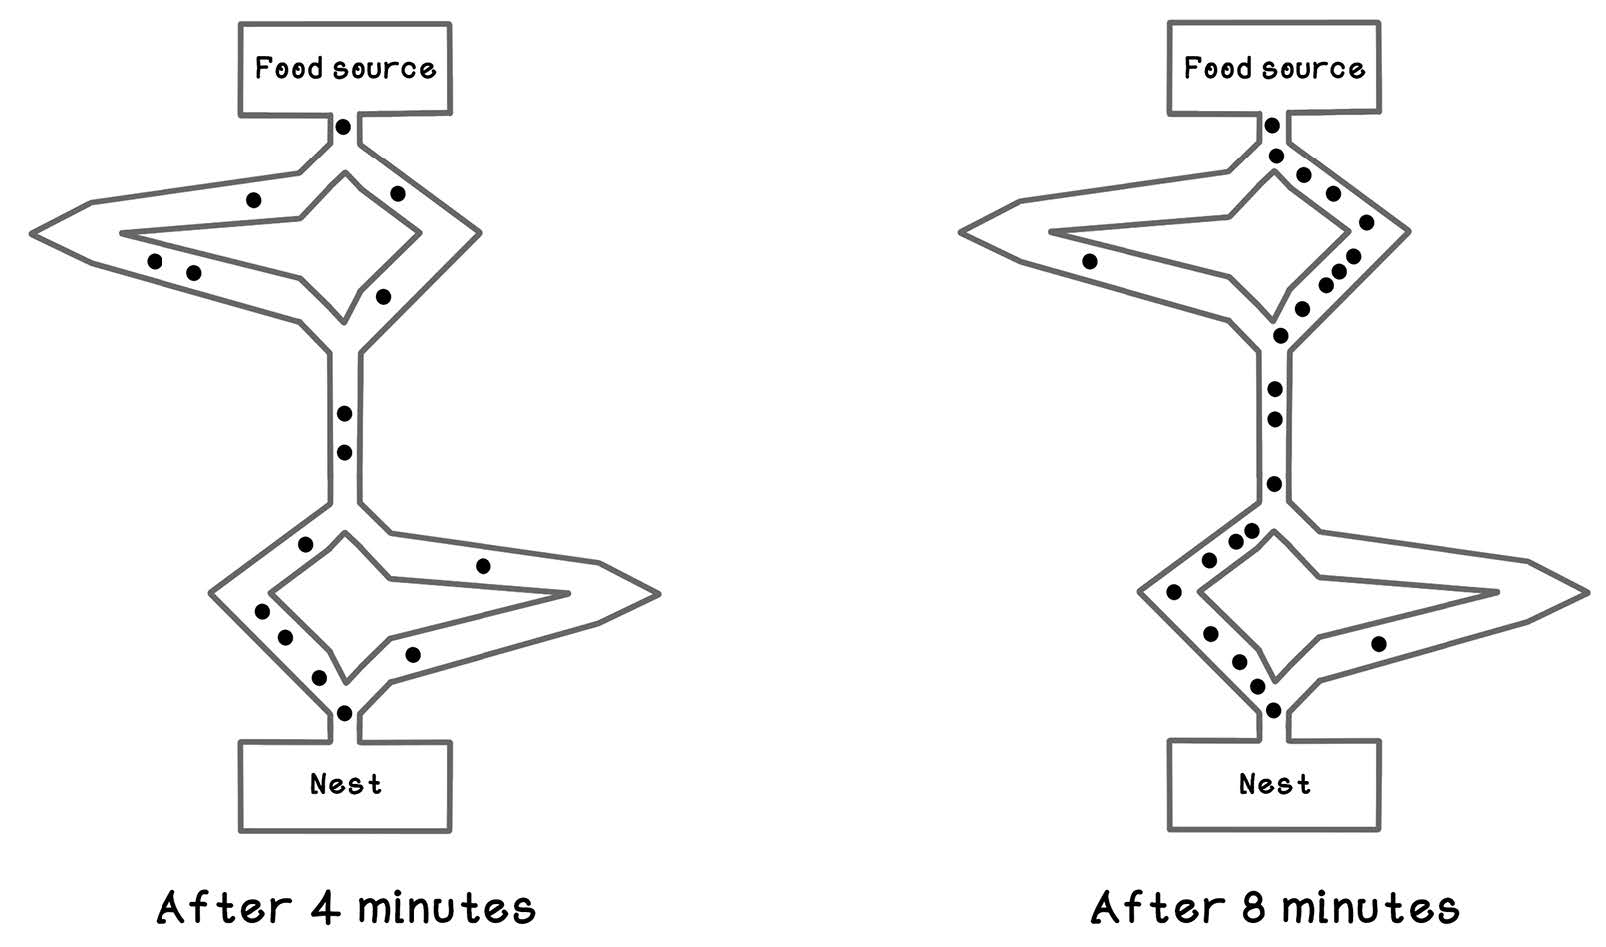
The asymmetric bridge experiment illustrates how ants converge on a shorter route as pheromone builds up. section 6.1
In a simple route-finding implementation, pheromone trails change through a repeated cycle:
- Initialize a matrix of trail intensities. Each entry represents the path between two attractions; giving every entry the same initial value, such as 1, avoids favoring a path at the start. section 6.5
- Choose each ant’s next unvisited attraction using pheromone intensity and a distance heuristic. A roulette-wheel selection gives attractive paths a larger chance without ruling out alternatives. section 6.7
- After the tours, evaporate existing pheromone by multiplying it by a factor. Add pheromone to paths used by ants, with better tours contributing more. Evaporation lets old information fade unless it is reinforced. section 6.8
- Repeat the tours and updates for several iterations, keeping track of the best route found. section 6.4
Comparing two paths
From the circus, suppose only the carousel and balloons remain unvisited. The carousel path has intensity 8 and distance 4; the balloons path has intensity 2 and distance 8. If pheromone and inverse distance each have weight 1, their selection scores are 8/4 = 2 and 2/8 = 0.25. The carousel is more likely, but the balloons can still be selected. section 6.3 section 6.7
Pheromone is not limited to physical routes. In image edge detection, simulated ants move between pixels and leave stronger trails based on pixel-color intensity, helping trace object outlines. section 6.11