In ant colony optimization, pheromone evaporation reduces the pheromone weight on every graph edge by a chosen percentage. This negative feedback weakens old paths and helps prevent the swarm from getting stuck on a mediocre route. section 8.1 section 8.4
Halving the weights
With a 50% decay rate, every edge starting at 1.0 falls to 0.5 after evaporation. In a 60-mile tour example, traversed edges then receive a separate deposit, reaching 2.17; ignored edges remain at 0.5. section 8.1
Figure 8.3 The graph state after one complete ant tour. Traversed edges (solid lines) receive a pheromone deposit, compounding their weight to 2.17. Ignored edges (dotted lines) suffer from mandatory evaporation, reducing their weight to 0.5. Over multiple iterations, the dotted lines will evaporate entirely to zero.
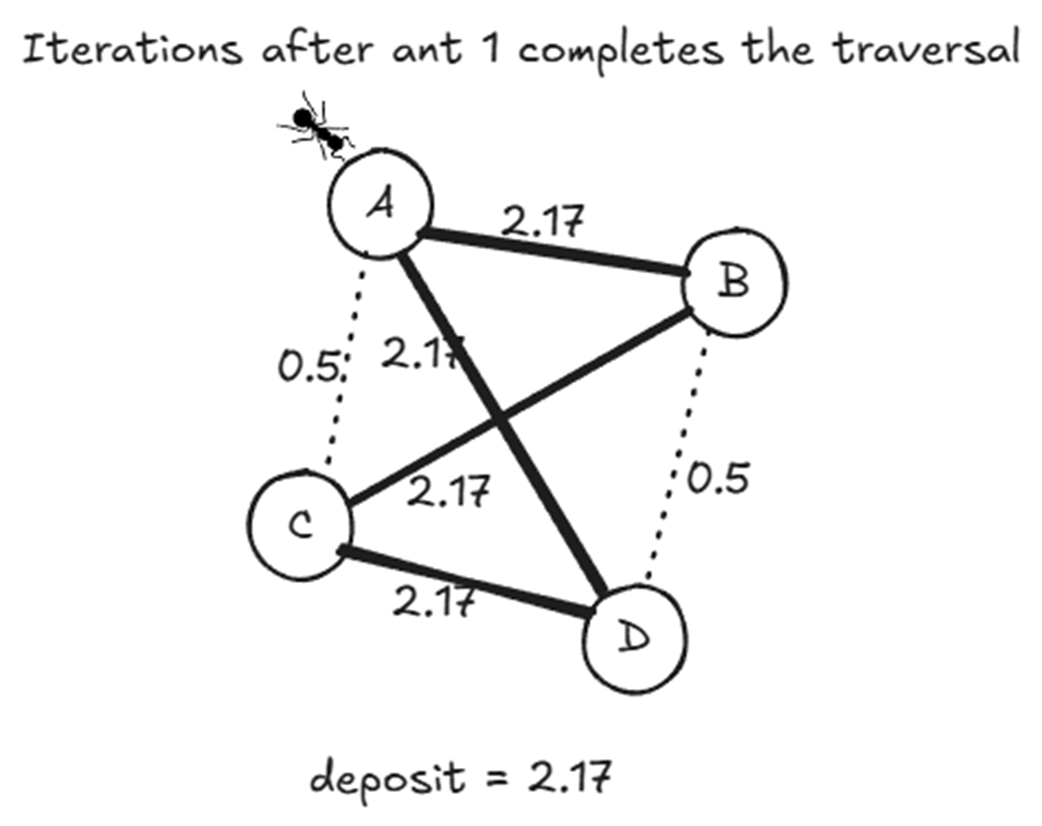
The graph shows traversed edges gaining pheromone while ignored edges lose it through evaporation; repeated updates can reduce ignored paths further. section 8.1