A pie chart shows parts of a whole as slices of a circle. Its donut-chart cousin does the same job with a center opening—handy space for a label. Both can be engaging and effective when the message is a simple share of a total. section 6.1.1
The catch is perception: people are poor at estimating angles. A pie chart becomes hard work when it has many slices or when slices are nearly the same size. Keep the chart to two or three segments where possible; if viewers need to distinguish similar shares, choose another chart type instead. section 6.1.1 section 6.4
Use a pie or donut chart when it keeps the comparison obvious rather than making readers squint at wedges:
- Show a small number of mutually meaningful parts of one whole. section 6.1.1
- Favor two-segment questions such as passed versus did not pass, or a named group versus others. section 6.1.1
- Avoid asking viewers to compare separate pie or donut charts against one another. section 6.1.1 section 6.4
- Use a donut when a central label helps state the point directly. section 6.1.1
Bagged avocados versus others
A two-segment donut chart can show the percentage of avocado sales that were bagged, with the remainder grouped as Others. This is a good fit because the viewer only needs to grasp one simple split, not compare a buffet of similarly sized slices. section 6.1.1
Figure 6.1 A nice, clean donut chart that shows the percentage of three months of avocado sales, which were bagged avocados, in green (Open data from https://hassavocadoboard.com/)
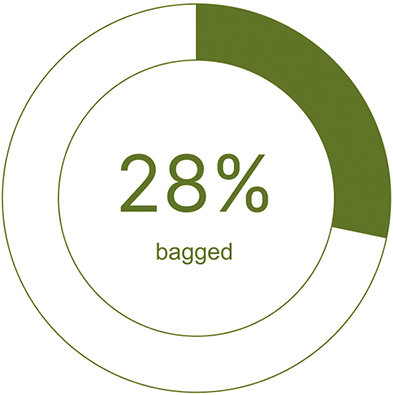
This donut-chart example makes the intended reading immediate: one highlighted share of avocado sales versus the rest. section 6.1.1


