Plate modeling visualizes repeated variables in a probabilistic machine-learning or causal DAG while preserving their lower-level dimensional detail. A rectangle, or plate, groups repeated variables into a subgraph; a number records how many entities repeat, and nested plates represent repetition within repetition. section 5.1.2
Image pixels and training data
An image represented by 784 pixels need not appear as 784 separate DAG nodes. A plate can group pixels Xj, with j indexing each pixel; another plate can represent the repeated images in a training set. section 5.1.2
Figure 5.7 A plate model representation of the causal DAG. Plates represent repeating variables, in this case 28 × 28 = 784 pixels. Xj is the jth pixel.
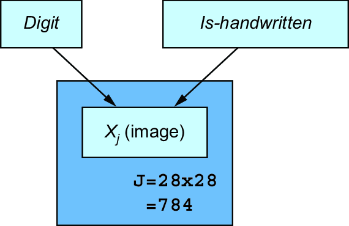
Use the plate-model diagram to inspect how 28 × 28 pixels become indexed repeated variables within a causal DAG. section 5.1.2
