Plate notation represents variables that repeat in a directed acyclic graph (DAG) by enclosing them in rectangles, or plates. A repetition count on each plate preserves dimensional detail without drawing every node individually. section 5.1.2
Use plate notation to make repeated structure explicit:
- Group repeating variables or subgraphs inside a plate; for image data, one plate can represent 784 pixels instead of 784 separate nodes. section 5.1.2
- Write the number of repetitions on the plate and index its elements with a subscript such as Xj for the jth pixel. section 5.1.2
- Nest plates when repeated entities contain their own repeated structure, then extend the model across the training images. section 5.1.2
Figure 5.7 A plate model representation of the causal DAG. Plates represent repeating variables, in this case 28 × 28 = 784 pixels. Xj is the jth pixel.
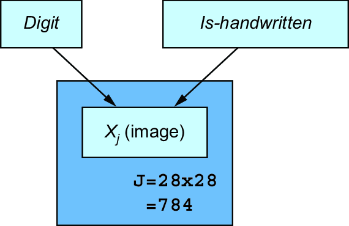
The plate model shows how a causal DAG represents the 28 × 28 pixel structure of one image. section 5.1.2
