When data bends instead of following a line, polynomial regression fits a curve so the model can represent more complex relationships. section 3.28 section 3.37
A polynomial combines powers of an input, such as x, x², and x³. Its degree is the highest power: degree 1 gives a line, degree 2 a parabola, and degree 3 a cubic curve. section 3.29
Build polynomial regression by expanding the data, then using familiar linear regression:
- Choose the polynomial degree before training; a cubic, for example, adds the feature's square and cube as extra columns. section 3.30
- Apply linear regression to the expanded columns. The resulting linear combination becomes a polynomial in the original feature. section 4.14
- Test the model and consider regularization when higher degrees make the curve unnecessarily complex; Lasso and Ridge provide L1 and L2 options. section 4.14
A downward-opening parabola
A dataset shaped like a downward-opening parabola cannot be fit well by a straight line. Polynomial regression can represent the curve; in scikit-learn, PolynomialFeatures(degree=20) creates powers through x²⁰ before a regression model is fitted. section 4.14
Figure 3.26 Polynomial regression is useful when it comes to modeling nonlinear data. If our data looks like the left part of the figure, it will be hard to find a line that fits it well. However, a curve will fit the data well, as you can see in the right part of the figure. Polynomial regression helps us find this curve.
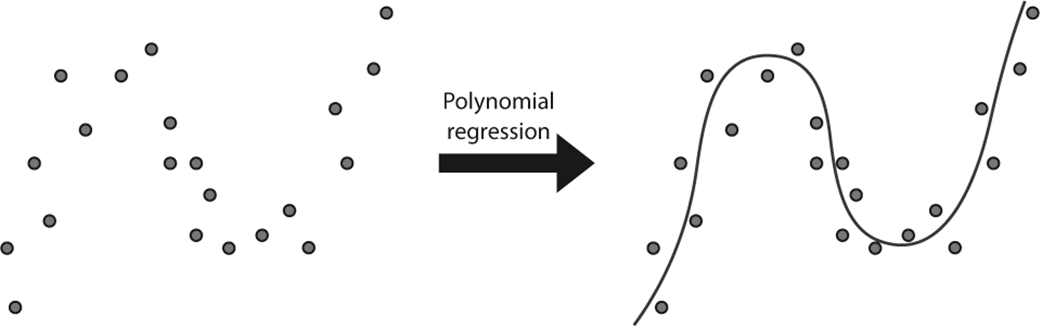
Compare a poorly fitting line with a polynomial curve fitted to nonlinear data. section 3.30

