Population density measures how many people inhabit a given unit of geographic area. In maps, it can be either the subject of the story or a hidden influence that makes other measures look meaningful. section 6.3.2
Watch for the population density effect when mapping location-based totals:
- Raw counts of votes or sales often reveal mainly where people are concentrated, rather than the intended behavior or outcome. section 6.3.2
- Normalize the measure when areas have unequal populations: use sales per customer or the percentage of residents who voted instead of whole numbers. section 6.3.2
- Choose the visual form to match the question: density maps show concentration, while choropleths can show normalized geographic rates. section 6.3.2 section 6.3.1
Votes versus voter turnout
A county map shaded by total votes may simply reproduce the map of population density. Replacing the count with the percentage of residents who voted gives sparsely and densely populated counties equal footing and better represents turnout. section 6.3.2
Figure 6.19 While this is a truthful map showing the number of total votes by county in the 2016 US Presidential Election, it’s not a particularly insightful one because it’s really just a map of where the people are, that is, it suffers from the population density effect (McGovern et al. [1]).
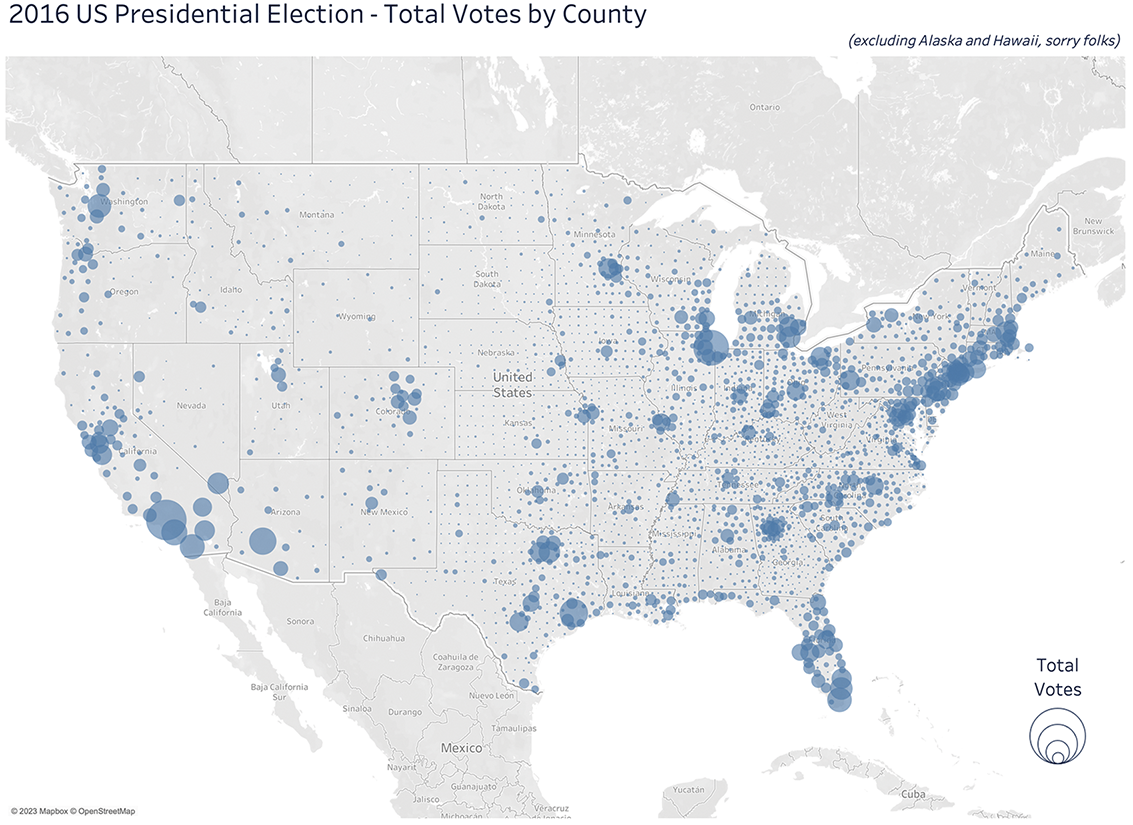
Compare a truthful but weak map of total votes with a normalized view that avoids mistaking population concentration for the intended insight. section 6.3.2
