Before comparing treatments, ask a practical question: within every relevant kind of person or situation, have both alternatives actually occurred? The positivity assumption says that for every confounder profile present in the population, each treatment has a probability strictly between 0 and 1 of being assigned. Without such variation, a causal effect requires guessing about an unobserved situation rather than learning from comparable cases. section 2.2.6 section 5.0
A treatment never tried for small stones
Suppose treatment A was used only for large kidney stones. Even if outcomes are available for large stones, there is no evidence for how A works on small stones: P(T=A|Size=small)=0. More observations may fill a sparse cell caused by chance, but they cannot fix a treatment policy that deliberately never assigns A to small-stone patients. section 2.2.6
Positivity is needed when using adjustment to turn observational comparisons into causal estimates. It is distinct from a causal graph: a DAG can identify confounders and adjustment variables, but arrows do not reveal whether the data contain both treatments for every confounder pattern. Check treatment variation after defining the causal question and graph. section 2.6 section 3.2.5
A useful operational check is:
- List the confounders that define the situations to be compared, using domain knowledge rather than prediction convenience. section 3.2
- Look for subgroups represented in only one treatment group; those cases have no counterpart under the alternative. section 5.1.2
- Restrict the analysis to common-support cases when overlap exists only for a subset; do not claim an effect outside that subset. section 3.2.5 section 3.6
- Recognize that many confounders make positivity harder: every observed combination needs treatment variation, while combinations grow rapidly. section 2.5.5
Discounts across purchase-frequency groups
If frequent purchasers always receive large discounts and infrequent purchasers always receive small ones, discount size is inseparable from purchase history. Randomly assigning both discount sizes within both frequency groups preserves the comparisons needed to estimate the discount effect. section 3.3.2
With continuous or numerous confounders, exact matches are often unrealistic. Similar cases may be treated as comparable, but that judgment is supported rather than proven by data. Binning a continuous variable can help inspect overlap, although wide bins combine meaningfully different cases and narrow bins leave too few observations. section 5.1.3 section 5.2.3
Figure 5.9 The distribution of propensity scores between the two groups shows no overlap, indicating that there are no matches between the groups. Consequently, we cannot calculate ATEs.
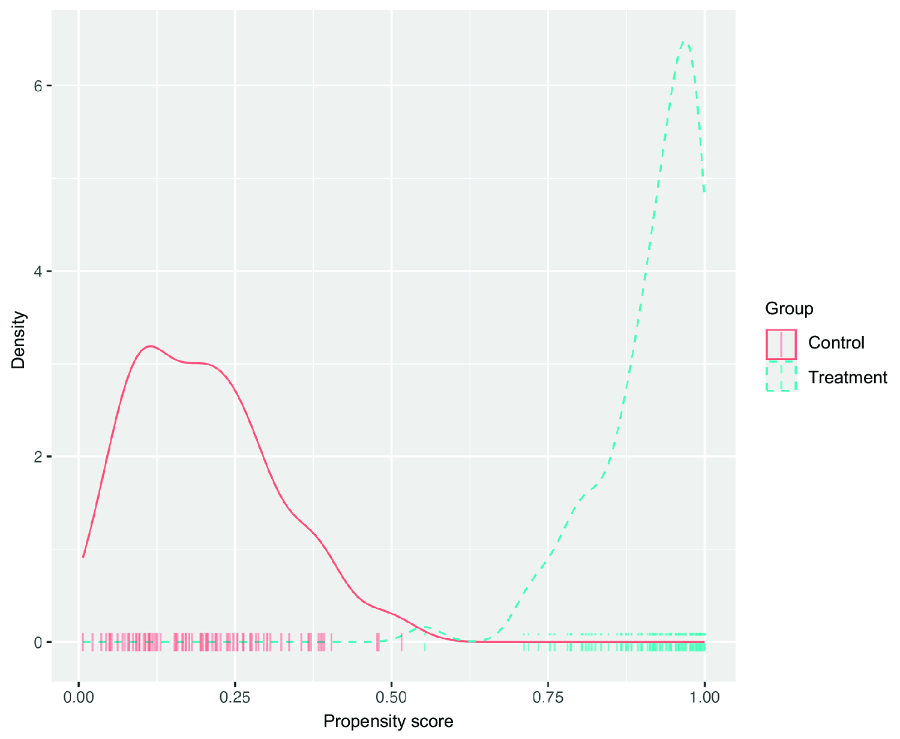
Compare the treatment and control propensity-score distributions: no overlap means no comparable cases and no ATE for that population. section 5.3.3
A propensity score summarizes the probability of treatment from a confounder profile. Scores near 0 or 1 signal that treatment is essentially determined for that profile; overlap between treatment groups supports comparison. Propensity scores can replace an unwieldy check across every raw confounder combination, then be reused for average treatment-effect calculations. section 5.1.2 section 5.3.3 section 5.7
