Qualitative research gathers words rather than numbers: people’s opinions, attitudes, behaviors, and needs. Interviews, observation, conversations, and focus groups help uncover why users react to a product or interface in a particular way. That insight gives design decisions a human starting point instead of relying only on assumptions. section 4.2.1
Use it when a metric raises a question. Analytics may show that people are not clicking an expected page item, but qualitative research can reveal the reason: what they found confusing, unhelpful, or misaligned with their expectations. Pair those findings with quantitative evidence to form and validate stronger design decisions. section 4.2.1
Common qualitative approaches include:
- Interviewing or speaking with users directly to learn about their experiences and needs. section 4.2.1
- Observing users and discussing what they do, which can expose attitudes and behaviors behind an interaction. section 4.2.1
- Running a focus group: a guided discussion with five to ten participants about a topic, product, or product area. section 4.2.3
A focus group supports deeper follow-up than a survey because participants are present for discussion. Ask targeted questions when an answer needs clarification, then listen for likes, dislikes, beliefs, and problems. It can be useful early, before a design exists, by discussing competitors or a generalized product experience. section 4.2.3
Choosing focus-group participants
Invite people who understand the topic. Include both people who have used similar products and prospective users, so the discussion can surface expectations as well as fresh reactions. A group without relevant product-area knowledge cannot provide the informed discussion the method depends on. section 4.2.3
Figure 4.5 Google Analytics dashboard that details page clicks and average time spent on the page. This data is quantitative because we only have the numbers; we don’t have the why behind the numbers.
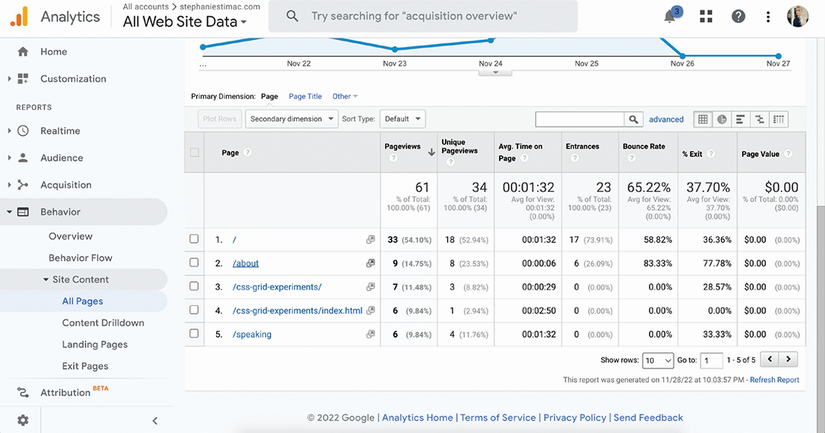
Page clicks and time on page can identify what is happening, while qualitative inquiry helps investigate why users behave that way. section 4.2.1