Queue time is the time a workflow job waits before it starts. For self-hosted runners, it is a primary signal of whether capacity arrives fast enough to keep users from waiting. section 7.2.1
Watch queue time especially with runners created on demand. Bursty submissions can lengthen waits quickly when runners cannot start fast enough. Scaling down too aggressively can also cause repeated scale-up and scale-down cycles. section 7.2.1
Use queue time alongside capacity patterns to guide scaling decisions:
- Compare it with concurrent jobs to understand normal runner demand, while treating queued work as potentially much spikier than normal execution. section 7.2.1
- Plan for scheduled workload peaks and large matrix runs so one spike does not leave all users waiting for the queue to clear. section 7.2.1
- Use DataDog CI Visibility for API-derived queue-time insights, but account for its cron-based collection rather than expecting real-time data. section 7.2.4
- Send queued, started, and completed job webhooks to a monitoring system when real-time visibility is needed; the receiving URL must be reachable by GitHub. section 7.2.4
Scaling through a queue surge
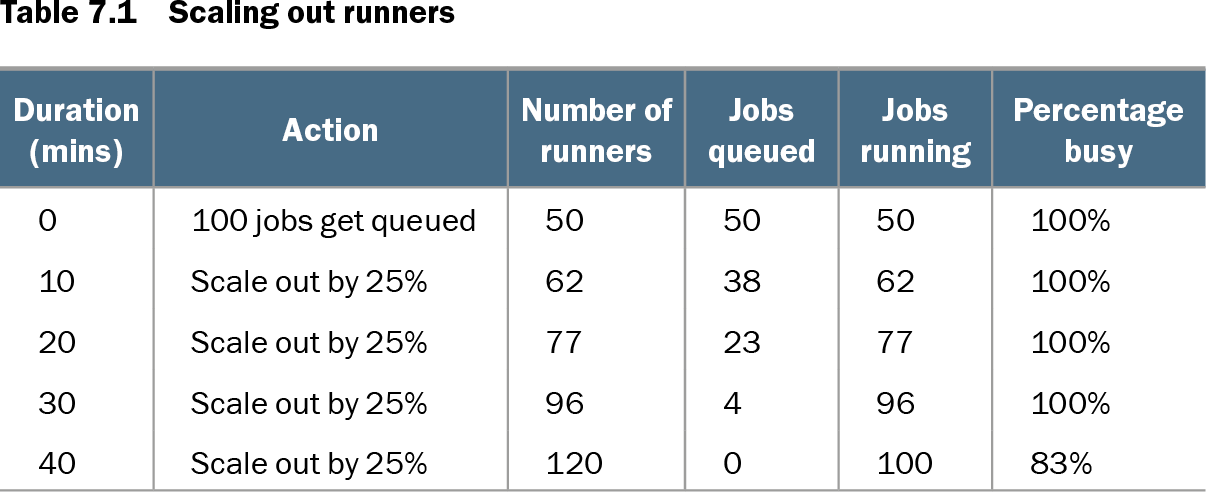
A scaling sequence starts with 100 queued jobs and 50 runners fully busy. Increasing runners by 25% every 10 minutes reduces queued jobs from 50 to 38, 23, 4, and then 0, while runner utilization eventually falls to 83%. This illustrates using queue pressure to increase capacity without assuming peak demand is permanent. section 7.2.1
Table 7.1 Scaling out runners (view table figure)
| Duration (mins) |
Action |
Number of runners |
Jobs queued |
Jobs running |
Percentage busy |
|---|---|---|---|---|---|
| 0 |
100 jobs get queued |
50 |
50 |
50 |
100% |
| 10 |
Scale out by 25% |
62 |
38 |
62 |
100% |
| 20 |
Scale out by 25% |
77 |
23 |
77 |
100% |
| 30 |
Scale out by 25% |
96 |
4 |
96 |
100% |
| 40 |
Scale out by 25% |
120 |
0 |
100 |
83% |
Review the runner, queued-job, running-job, and utilization changes during staged scale-out. section 7.2.1