Monitoring
Monitoring is the ongoing observation and measurement of a system or process to assess its behavior or condition and detect changes, failures, or other problems.
Troubleshooting Java, Second Edition
Logging is the technique of recording runtime events and diagnostic information from an application or virtual machine.
- How it is used
- Uses recorded runtime events to reconstruct behavior, troubleshoot failures, investigate performance, and uncover security breaches.
- How deep it goes
- Explains message types, formatting, frameworks, risks, stack traces, and GC activation, but defers comprehensive log analysis.
- Examples
- Demonstrates Log4j messages, severity configuration, caller traces, sensitive-data mistakes, and JVM GC output.
- What you can do after
- Diagnose/debug with it by reading logs, tracing callers, adjusting severity, and enabling GC output for targeted investigations.
Read how Troubleshooting Java, Second Edition explains monitoring →
Machine Learning Platform Engineering
Logging is the recording of timestamped events, states, and diagnostic information produced by a software system.
- How it is used
- Keeps deployed ML services observable so teams can detect operational failures, data drift, and deteriorating model behavior.
- How deep it goes
- Works through metrics collection, dashboard verification, and windowed drift reports; does not specify a universal alert threshold or window size.
- Examples
- Uses a FastAPI metrics endpoint, a BentoML service dashboard, and windowed drift reports for an income-classification API.
- What you can do after
- Operate/configure monitoring for an API service, verify metrics collection, and investigate drift with windowed reports and logs.
Read how Machine Learning Platform Engineering explains monitoring →
Cloud Observability in Action
Logging is the practice of recording textual or structured events produced by a system or application.
- How it is used
- Supports debugging, testing, incident response, security investigation, and correlation across observability signals.
- How deep it goes
- Defines events, levels, formats, practices, instrumentation, costs, routing, and Kubernetes limitations through working examples.
- Examples
- Uses Sock Shop services, an instrumented Go echo service, Logrus JSON events, kubectl logs, and centralized Kubernetes routing.
- What you can do after
- Diagnose/debug with it by emitting structured events, querying Kubernetes logs, and correlating logs with metrics and traces.
Read how Cloud Observability in Action explains monitoring →

Apache Kafka in Action
A log is an append-oriented sequence of records that captures occurrences or changes over time.
- How it is used
- Detects Kafka performance and reliability problems across infrastructure, brokers, and clients before they disrupt service.
- How deep it goes
- Works through metric categories, capacity thresholds, alert quality, and deployment-specific responsibilities without specifying a complete monitoring setup.
- Examples
- Uses disk and network headroom, transient rebalancing load, producer errors, and consumer lag as concrete signals.
- What you can do after
- Operate/configure it by tracking capacity and health metrics, setting contextual alerts, and adjusting coverage to the deployment.

Effective Platform Engineering
Structured logging is the practice of emitting log records in a machine-readable format with consistent fields and values.
- How it is used
- Tracks known service and platform health indicators so teams can detect problems and respond before users are affected.
- How deep it goes
- Defines monitoring against observability and sketches dashboards, alerts, and external checks, but does not specify alert-rule syntax or thresholds.
- Examples
- Uses CPU and error-rate indicators, payment-service objectives, and external checks for Kubernetes clusters and their observability platform.
- What you can do after
- Operate/configure it by selecting known health indicators, setting up dashboards and alerts, and checking the platform from an external system.
Read how Effective Platform Engineering explains monitoring →

Machine Learning System Design
The practice of recording timestamped events, inputs, outputs, and contextual identifiers generated by a software system.
- How it is used
- Supports ongoing ML-system reliability and experiment management through logs, metrics, and timely investigation.
- How deep it goes
- Gives logging fields, metric categories, checks, alerts, and response options while deferring extensive software-reliability coverage.
- Examples
- Uses stock-photo search logs, retail demand-forecasting metrics, and a contextual fraud-score log message.
- What you can do after
- Operate and configure monitoring by selecting signals, recording prediction context, and preparing responses to failures.
Read how Machine Learning System Design explains monitoring →
LLM Evaluation and Alignment, The Foundational Ideas
Online monitoring is the continuous observation of a deployed system’s behavior and operational metrics.
- How it is used
- Tracks deployed AI behavior to detect degradation and inform ongoing alignment updates.
- How deep it goes
- Outlines sampling, scoring, alerting, review, and trace-based diagnosis without providing an implementation.
- Examples
- Uses RAG metric combinations and agentic traces to distinguish a malformed query from a retrieval failure.
- What you can do after
- Diagnose production RAG regressions using metric trends and traces, then route risky outputs for review.
Read how LLM Evaluation and Alignment, The Foundational Ideas explains monitoring →
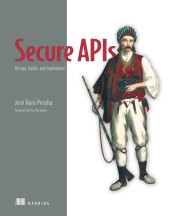
Secure APIs
A log is a recorded entry describing an event, action, or state change in a software system.
- How it is used
- Supports API observability, security monitoring, threat detection, debugging, and investigation of system behavior.
- How deep it goes
- Explains event records, security fields, sensitive-data exclusion, replay, and correlation with traces, but defers detailed log-management configuration.
- Examples
- Uses HTTP requests, errors, injection attempts, status codes, latency, trace context, and an order payload excluding credit-card data.
- What you can do after
- Diagnose failures, investigate threats, reproduce suspicious requests, and detect unusual API activity with recorded evidence.
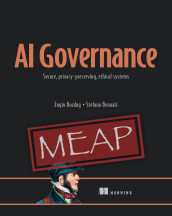
AI Governance
Observation of a system or process to track its status, behavior, or performance.
- How it is used
- Supports continuous governance and incident detection for generative AI integrations and agents.
- How deep it goes
- Specifies telemetry, review, investigation, and containment practices without providing a full implementation.
- Examples
- Uses a claims-status agent making unexpected tool calls and an update that increases disallowed data-source attempts.
- What you can do after
- Operate/configure monitoring by selecting telemetry, connecting alerts, reviewing traces, and tightening agent restrictions during investigation.

ASP.NET Core in Action, 3e
Logging is the recording of diagnostic or operational messages generated by an application.
- How it is used
- Records application events and diagnostic context for production troubleshooting, auditing, and analytics.
- How deep it goes
- Explains logger and provider roles, message properties, filtering, and structured placeholders, with practical production guidance.
- Examples
- Uses a recipe application to log loaded recipe counts and warn about missing recipes.
- What you can do after
- Apply logging via ASP.NET Core ILogger and configure providers and filtering for application diagnostics.
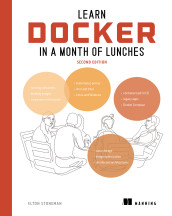
Learn Docker in a Month of Lunches, Second Edition
A log record is a structured or unstructured event message describing activity or state in an application or system.
- How it is used
- Provides ongoing visibility into containerized application behavior and performance so people can respond when automated operation is not enough.
- How deep it goes
- Works through metrics collection and dashboard design, then assigns a hands-on Compose lab; it does not require modifying application source code.
- Examples
- Uses an image-gallery summary dashboard and a to-do list lab tracking tasks created and HTTP request counts.
- What you can do after
- Build it from scratch with Docker Compose, Prometheus, and Grafana to scrape supplied application metrics and display a dashboard.
Read how Learn Docker in a Month of Lunches, Second Edition explains monitoring →
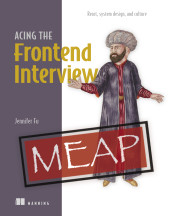
Acing the Frontend Interview
A log is a record of discrete events and associated context emitted by a software system.
- How it is used
- Supports operational reliability by detecting distributed-system issues in real time and triggering alerts or automated recovery.
- How deep it goes
- Defines monitoring's role and identifies health checks and alerts, but does not specify alert rules or recovery procedures.
- Examples
- Uses replication lag, shard balance, and partition health as measures of distributed-system state.
- What you can do after
- Evaluate/understand how health checks and observability signals support issue detection and diagnosis across nodes.
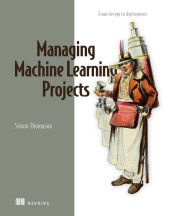
Delivering Machine Learning Projects: From design to deployment
Monitoring is the systematic inspection and recording of a system's behavior to detect issues and notify responsible parties.
- How it is used
- Supports safe deployment, production operation, and maintenance of ML systems.
- How deep it goes
- Defines monitoring and specifies logging, alerting, and support checks without prescribing a particular implementation.
- Examples
- Illustrates changing prediction conditions with a music-sales model built before streaming became widespread.
- What you can do after
- Diagnose production failures using logs and evaluate whether performance monitoring and support alerts are in place.
Read how Delivering Machine Learning Projects: From design to deployment explains monitoring →
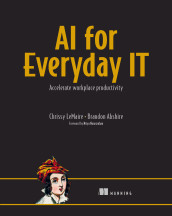
AI for Everyday IT
Logging is the recording of runtime events and diagnostic information produced by a software system.
- How it is used
- Uses logs to diagnose system problems and give AI assistants runtime context for development and security monitoring.
- How deep it goes
- Explains logging patterns and security checks through prompts and examples, while leaving environment-specific configuration for further review.
- Examples
- Uses a dropped-packet investigation, an Express authentication logging pattern, and an IIS configuration audit.
- What you can do after
- Diagnose problems with logs by locating relevant system records and supplying runtime context to an AI assistant.
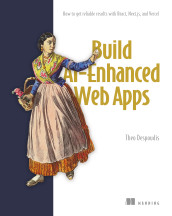
Build AI-Enhanced Web Apps
Logging is the recording of runtime events and values to support software observation, diagnosis, and debugging.
- How it is used
- Supports debugging, performance observation, production reliability, and investigation of access to chat histories.
- How deep it goes
- Gives monitoring strategies and a deployment checklist, while deferring detailed implementation of most data-protection controls.
- Examples
- Uses AI request latency, long message histories, and failed Vercel deployments to illustrate investigation.
- What you can do after
- Diagnose application latency and state changes with monitoring tools and logs, and investigate chat-history access through audit records.

The Art of Code
Logging is the recording of application events, errors, and contextual information for diagnosis, monitoring, and auditing.
- How it is used
- Supports failure investigation and monitoring through selective, persistent logging.
- How deep it goes
- Explains logging decisions and antipatterns, including output destinations, diagnostic context, and the costs of excessive logging.
- Examples
- Illustrates console-only logging, repeated invalid credentials, and a failed web form traced through an HTTP 500 and application logs.
- What you can do after
- Diagnose failures with contextual logs and decide which events warrant logging or monitoring.

Generative AI in Action
Logging is the recording of software events, states, and diagnostic information for operational analysis and troubleshooting.
- How it is used
- Supports ongoing health, performance, and responsible-operation checks for deployed enterprise generative AI applications.
- How deep it goes
- Distinguishes monitoring, logging, and tracing, identifies operational metrics, and demonstrates request measurement with observability tools.
- Examples
- Uses a console chat application with MLflow to measure request latency and token counts.
- What you can do after
- Apply monitoring with Prometheus and Grafana to collect and visualize operational metrics.
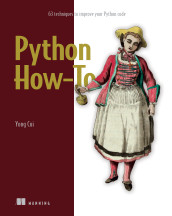
Python How-To
Logging is the recording of program events and diagnostic information through a structured message mechanism.
- How it is used
- Uses logging to monitor application events and investigate production problems that may be difficult to reproduce.
- How deep it goes
- Works through logger, handler, level, and formatter configuration, while mentioning other handler types without detailing them.
- Examples
- Uses task-management events, separate warning and critical files, and formatted console output to demonstrate logging.
- What you can do after
- Apply it via Python’s logging module to configure destinations, filter severity, and format records.
GitHub Actions in Action: Continuous integration and delivery for DevOps
Monitoring is the systematic observation of system state, resource usage, and operational metrics.
- How it is used
- Guides capacity, scaling, utilization, and network-security decisions for self-hosted runners.
- How deep it goes
- Explains metrics, alerts, scaling strategies, agent telemetry, and egress enforcement, while requiring custom uptime and utilization monitoring.
- Examples
- Uses a 100-job scaling burst, scheduled availability alerts, telemetry charts, and harden-runner audit-to-block configuration.
- What you can do after
- Operate/configure runner monitoring that alerts on shortages, informs scaling, correlates workload resource use, and restricts observed network egress.
Think Like a CTO
Monitoring is the continuous observation and measurement of software or infrastructure behavior to detect problems and assess operational status.
- How it is used
- Keeps platform health and client availability visible so teams can act before problems become client reports.
- How deep it goes
- Explains two monitoring perspectives, basic metrics, baselines, and centralized logs without specifying alert thresholds or implementation steps.
- Examples
- Uses disk usage, memory changes, and web-application SQL errors to show how early signals can lead to investigation.
- What you can do after
- Practice/perform outside-in and internal checks, then investigate abnormal metrics and related logs before clients report failures.

Kafka for Architects
Logging is the recording of structured or textual runtime information about software execution and events.
- How it is used
- Tracks deployed Kafka systems’ health, resource use, processing backlog, and failures so teams can respond before service objectives suffer.
- How deep it goes
- Defines metrics and alerts, details consumer-lag interpretation, and sketches log collection; stops short of a complete operational or implementation guide.
- Examples
- Uses a Customer 360 log pipeline, a consumer group falling behind, and hard-to-trace chained processors.
- What you can do after
- Operate/configure it by tracking resource and Kafka-specific metrics, routing alerts, and coordinating monitoring ownership across teams.
Automating API Delivery
Monitoring is the collection and presentation of predefined system measurements with dashboards and alerts to reveal known conditions.
- How it is used
- Detects known production API health problems and feeds measurements back to the development team.
- How deep it goes
- Defines metric categories and alerting, then outlines synthetic checks without providing a full monitoring configuration.
- Examples
- Uses slow APIs, unexpected errors, 5xx alerts, traffic spikes, and simulated authentication and requests.
- What you can do after
- Operate/configure it by selecting API health metrics, setting condition-based alerts, and scheduling synthetic checks.

Unit Testing Principles, Practices, and Patterns
Logging is the recording of application events, state, or diagnostic information for later observation or analysis.
- How it is used
- Frames logging as a testing and design decision based on observable behavior, stakeholder needs, and maintenance cost.
- How deep it goes
- Works through concrete logging code, refactorings, structured data, domain events, and dependency choices rather than offering only a definition.
- Examples
- Uses User.ChangeEmail, DomainLogger, structured log renderings, domain events, static logger storage, and explicit logger injection.
- What you can do after
- Evaluate/understand which logging behavior warrants tests and choose an appropriate coupling and representation strategy.
Read how Unit Testing Principles, Practices, and Patterns explains monitoring →
Fundamentals of Cybersecurity
A log is a chronological record of events, activities, or state changes generated by a system, application, device, or security tool.
- How it is used
- Uses monitoring to spot suspicious activity, investigate incidents, and trace access to people and systems.
- How deep it goes
- Explains log fields, audit trails, suspicious patterns, privileged-access records, and centralized analysis; does not provide a configuration procedure.
- Examples
- Uses a Windows access record and repeated failed logins to show what an individual event and a suspicious pattern look like.
- What you can do after
- Diagnose/debug with it by checking access-log details and investigating unusual sequences of events.
Read how Fundamentals of Cybersecurity explains monitoring →
PostgreSQL Mistakes and How to Avoid Them
A database log is a chronological record of database events, errors, activity, and operational information written for monitoring and diagnosis.
- How it is used
- Provides early warning of PostgreSQL capacity, performance, integrity, security, and maintenance problems.
- How deep it goes
- Explains operational metrics, log inspection, alerting, and diagnosis without specifying a complete monitoring-system implementation.
- Examples
- Uses a misspelled-table retry loop, corruption-style read errors, failed authentication output, and grep filtering of ERROR and FATAL logs.
- What you can do after
- Operate/configure it by defining metrics and alerts, reviewing logs, and tracing observed symptoms to likely causes.
Read how PostgreSQL Mistakes and How to Avoid Them explains monitoring →
Think Like a Software Engineering Manager
Monitoring is the continuous observation and measurement of software systems and their operation to detect changes, failures, or performance issues.
- How it is used
- Provides operational visibility for detecting failures and evaluating whether organizational changes achieve their intended results.
- How deep it goes
- Explains monitoring through alerts, dashboards, logs, run books, success criteria, surveys, and retrospectives, without implementation details.
- Examples
- Uses service-health dashboards, outage alerts, logs, run books, surveys, retrospectives, and portfolio performance monitoring.
- What you can do after
- Diagnose and mitigate operational problems, verify recovery, and evaluate organizational changes against defined success criteria.
Read how Think Like a Software Engineering Manager explains monitoring →
Building Reliable AI Systems
The ongoing observation of a deployed AI system's behavior, performance, and quality.
- How it is used
- Keeps deployed AI systems reliable by observing quality, user experience, operational performance, and cost over time.
- How deep it goes
- Details layered quality checks, recurring hallucination sampling, cost baselines, alerts, and user-feedback signals.
- Examples
- Uses a chatbot’s incorrect refund policy, a warranty hallucination, and a prompt change that triples costs.
- What you can do after
- Diagnose/debug with quality signals, feedback trends, and cost alerts to investigate deployed-system failures.

Amazon Web Services in Action, Third Edition: An in-depth guide to AWS
A log is an ordered record of events or messages generated by a software system or infrastructure component.
- How it is used
- Uses logs and metrics to debug failures, check capacity and performance, and verify deployments.
- How deep it goes
- Gives console procedures for EC2 logs and metrics and Lambda log searches; notes update delays, missing default memory metrics, and detailed-monitoring cost.
- Examples
- Uses EC2 startup logs and load graphs, Lambda website-health-check messages, and database and cache metrics.
- What you can do after
- Operate/configure it by inspecting EC2 and Lambda logs and metrics, then setting CloudWatch alarms for database thresholds.
Build Financial Software with Generative AI (From Scratch)
A log is a chronological record of system events, messages, or activity produced by an application or infrastructure component.
- How it is used
- Supports API capacity assessment, audit review, and proactive detection of unexpected financial activity.
- How deep it goes
- Works through middleware-based audit logging and review rationale, while deferring full audit management and limit-alert workflows.
- Examples
- Uses ACH file retrieval audit messages and a $15,000 debit batch exceeding a $10,000 daily expectation.
- What you can do after
- Apply logging via FastAPI middleware to capture request and response details for audit review.
Read how Build Financial Software with Generative AI (From Scratch) explains monitoring →

Go in Practice, Second Edition
Logging is the recording of program events and diagnostic information for later inspection.
- How it is used
- Supports production problem detection, scaling decisions, and application diagnosis through logs and runtime measurements.
- How deep it goes
- Shows periodic runtime polling in a goroutine and compares basic with structured logging; does not detail a monitoring-service deployment.
- Examples
- Uses log-level calls and a Go workload that creates goroutines while recording goroutine count and allocated memory.
- What you can do after
- Build it from scratch using Go’s runtime measurements and logging packages to record application events and resource use.
Read how Go in Practice, Second Edition explains monitoring →

Learn Go with Pocket-Sized Projects
Logging is the practice of recording information about a program's execution for later inspection or analysis.
- How it is used
- Uses logging to follow execution, diagnose bugs, communicate system state, and support monitoring.
- How deep it goes
- Explains logging, logger output, configurable writers, message quality, storage cost, and data-selection tradeoffs.
- Examples
- Uses an unexpected count, console output, configurable writers, processing duration, large data, and structured warning entries.
- What you can do after
- Build it from scratch as a reusable logger and select concise, meaningful messages for operational diagnosis.
Read how Learn Go with Pocket-Sized Projects explains monitoring →
Financial AI in Practice
The ongoing observation of systems, signals, and outcomes to identify changes, failures, or control issues.
- How it is used
- Connects model signals and real-world outcomes to governed financial decisions and ongoing operational adjustments.
- How deep it goes
- Works through reference-versus-current scorecard comparisons, PSI tables, significance tests, and stability reports, while distinguishing a train-test demonstration from time-window monitoring.
- Examples
- Uses a credit scorecard comparison, evolving fraud patterns, and suspicious account activity to illustrate different monitoring targets.
- What you can do after
- Apply it via OptBinning’s ScorecardMonitoring to compare score distributions and review stability reports.

Functional Design and Architecture: Examples in Haskell
Logging is the recording of runtime events and diagnostic information produced by software.
- How it is used
- Uses logging as a foundational application subsystem for recording diagnostic events across business and transactional code.
- How deep it goes
- Explains interfaces, destinations, levels, delivery modes, formatting, interpreters, and STM buffering through implementation examples.
- Examples
- Uses C# file logging, console interpretation, meteor generation, smart-house interpreters, and delayed STM log flushing.
- What you can do after
- Build it from scratch as an abstract logger, concrete destination, free-monadic interface, or transaction-safe delayed logger.
Read how Functional Design and Architecture: Examples in Haskell explains monitoring →
AI Agents in Action, Second Edition
Logging is the recording of inputs, outputs, events, and intermediate execution steps for later inspection and analysis.
- How it is used
- Uses monitoring to make agent activity visible for debugging, incident resolution, and improvement.
- How deep it goes
- Defines logging and gives an observability checklist covering traces, metrics, structured logs, evaluator coverage, and privacy.
- Examples
- Illustrates trace instrumentation with a Phoenix project and session, user, and turn metadata.
- What you can do after
- Diagnose/debug with logs and traces to investigate agent and evaluator failures.
Read how AI Agents in Action, Second Edition explains monitoring →

LLMs in Production
A monitoring system observes a machine-learning system's data, resources, behavior, and outputs to detect degradation, failures, and operational issues.
- How it is used
- Catches silent model degradation and operational failures across training pipelines and production services.
- How deep it goes
- Combines metric categories, drift indicators, segmentation, tooling, and deployment patterns without detailing alert policies or remediation workflows.
- Examples
- Uses CPU and latency dashboards, regional or A/B segments, whylogs profiles, LangKit text metrics, and Kubernetes sidecars.
- What you can do after
- Diagnose/debug with it by detecting drift, resource failures, quality decay, and localized operational problems.
LLM Customization and Fine-Tuning
The ongoing observation of a deployed model to detect performance issues, failures, or drift in production.
- How it is used
- Sustains production reliability by observing model behavior as inputs, safety risks, and the surrounding environment change.
- How deep it goes
- Specifies logging, weekly review, rollback triggers, and monthly red-team testing, and names drift-detection methods.
- Examples
- Uses an IT support assistant whose satisfaction falls as requests, ticket categories, and tokenizer behavior change.
- What you can do after
- Operate monitoring through production log review, safety testing, predefined rollback triggers, and outcome-based retraining.
Read how LLM Customization and Fine-Tuning explains monitoring →
Data Pipelines with Apache Airflow, Second Edition
Logging is the recording of operational events and messages produced during software execution.
- How it is used
- Supports production operation by exposing Airflow activity, workload, failures, delays, and capacity pressure.
- How deep it goes
- Explains log categories, storage, scheduler files, four monitoring signals, and exporters, while deferring tracing.
- Examples
- Uses API access records, scheduler processing files, task logs, running-task dashboards, and Prometheus exporters.
- What you can do after
- Diagnose Airflow operation with logs and metrics, configure API-server log files, and track latency, load, errors, and saturation.
Read how Data Pipelines with Apache Airflow, Second Edition explains monitoring →

Starting Data Analytics with Generative AI and Python
Monitoring is the ongoing collection and analysis of system measurements to track behavior and detect changes or problems.
- How it is used
- Uses measurements and review to judge system efficiency, detect AI problems, and support timely improvement or intervention.
- How deep it goes
- Explains requirements, metrics, profiling, stress testing, comparison, and review, but does not specify implementation tools or detailed procedures.
- Examples
- Uses cloud migration, observatory, hospital, chemical-plant, and AI-employee analogies to show why monitoring priorities differ.
- What you can do after
- Diagnose performance bottlenecks, compare system changes, and identify misleading, biased, or incorrect AI outputs for correction.
Read how Starting Data Analytics with Generative AI and Python explains monitoring →
MongoDB 8.0 in Action, Third Edition
Database monitoring is the continuous observation of database health, resource usage, performance, and operational events.
- How it is used
- Uses continuous observation, metrics, logs, and alerts to maintain Atlas performance, reliability, security, and capacity awareness.
- How deep it goes
- Covers monitoring tools, alert conditions, notification routes, logs, and historical metrics without detailing alert configurations.
- Examples
- Uses Performance Advisor, Namespace Insights, the Real-Time Performance Panel, deployment metrics, MongoDB logs, and Atlas CLI health review.
- What you can do after
- Diagnose with Atlas performance tools, configure alerts, inspect logs, and identify security or capacity problems early.
Read how MongoDB 8.0 in Action, Third Edition explains monitoring →
AI Model Evaluation
The continuous observation of model behavior, system signals, and user outcomes during live operation.
- How it is used
- Connects production system signals and evaluation behavior to user-facing performance, release decisions, and live experiments.
- How deep it goes
- Combines cross-layer metrics, baseline-informed alert thresholds, rollback triggers, and offline-to-online watchpoints.
- Examples
- Tracks rendering time, API and inference latency, errors, timeouts, request cost, prompt failures, and evaluation-result drift.
- What you can do after
- Operate live monitoring by setting thresholds, alerting on known risks, and triggering traffic reduction or rollback.
Designing AI Systems
The observation of service telemetry to assess the operational condition of a platform or system.
- How it is used
- Tracks infrastructure condition, model accuracy, AI behavior, costs, and service health during production operation.
- How deep it goes
- Distinguishes traditional health metrics from AI correctness and reaches a service-level contract for telemetry ingestion and querying.
- Examples
- Uses support-ticket classification, a degraded patient-intake prompt, and unpredictable prototype latency to expose monitoring gaps.
- What you can do after
- Diagnose production behavior through dashboards, debugging queries, correlated telemetry, and platform-wide health views.

Digital Twins in Action
Logging is the recording of discrete events and contextual information produced by a software system.
- How it is used
- Uses monitoring to track sensor fleet health and support observability of digital twin behavior.
- How deep it goes
- Explains monitoring practices and structured log querying, while deferring industrial governance, security, and operational challenges.
- Examples
- Uses missed sensor transmissions, battery voltage, temperature prediction drift, and a structured state-update log as examples.
- What you can do after
- Diagnose digital twin behavior with structured logs and a CloudWatch query using a shared trace identifier.
Platform Engineering on Kubernetes
A log is a recorded event or message describing an operation or condition in software or infrastructure.
- How it is used
- Supports diagnosing distributed-service failures and verifying application behavior and performance.
- How deep it goes
- Explains centralized telemetry, dashboards, behavior, performance, and tracing, but stops short of runnable implementation instructions.
- Examples
- Uses centralized telemetry and an Approved-versus-Rejected proposals dashboard to illustrate operational visibility.
- What you can do after
- Evaluate service behavior and performance through collected telemetry, dashboards, traces, and SLA-oriented signals.
Read how Platform Engineering on Kubernetes explains monitoring →
Kubernetes in Action, Second Edition
A log file is a file containing records of events and diagnostic messages emitted by a process or application.
- How it is used
- Uses application logs to inspect container behavior, requests, startup messages, and diagnostic output.
- How deep it goes
- Explains stdout, stderr, runtime capture, retrieval, streaming, timestamps, and time filtering without detailing log aggregation.
- Examples
- Demonstrates Node.js startup messages, request entries, kubectl logs, live streaming, timestamps, and output limits.
- What you can do after
- Operate kubectl logs to retrieve, stream, timestamp, and limit logs from a running application pod.
Read how Kubernetes in Action, Second Edition explains monitoring →
Building Distributed Applications that Work
Monitoring is the continuous collection and analysis of application and infrastructure signals to detect problems and assess operational behavior.
- How it is used
- Uses monitoring to detect production problems and assess reliability, resource use, capacity needs, costs, and security activity.
- How deep it goes
- Names the included OpenTelemetry packages and dashboard views, but defers the mechanism for checking whether applications work correctly now.
- Examples
- Shows an online-shop Service Defaults project and Aspire dashboard tabs for console logs, structured logs, traces, and metrics.
- What you can do after
- Operates the Aspire dashboard to inspect telemetry across services and distinguish historical signals from current health checks.
Read how Building Distributed Applications that Work explains monitoring →

Akka in Action, Second Edition
Failure monitoring is the observation of actors for termination or failure signals so that recovery actions can be taken.
- How it is used
- Supports asynchronous actor tests and recovery designs for actor chains whose components must remain reachable.
- How deep it goes
- Explains probe interception and monitored-actor respawning, while leaving detailed signal-handling design to supervision.
- Examples
- Uses SimplifiedManager forwarding tests and a logging pipeline containing a file watcher, log processor, and database writer.
- What you can do after
- Apply monitoring through Behaviors.monitor and probes, or design actor chains that detect stopped components and respawn them.
Read how Akka in Action, Second Edition explains monitoring →

Google Anthos in Action
Monitoring is the collection and analysis of system or application signals to assess operational behavior and status.
- How it is used
- Supports proactive failure detection, incident response, system debugging, and continuous improvement across CI/CD operations.
- How deep it goes
- Explains thresholds, alert routing, full-stack debugging, and historical analysis, but does not detail implementation procedures.
- Examples
- Uses threshold warnings, rate-of-change warnings, routed failure alerts, full-stack observations, and historical monitoring data.
- What you can do after
- Evaluate system health, debug behavioral changes, respond to failures, and improve CI/CD operations using monitoring evidence.
Machines that Think
Monitoring is the ongoing observation and tracking of system behavior after deployment to detect changes or emerging problems.
- How it is used
- Tracks deployed system behavior to detect emerging failure modes and unequal patterns, supporting iterative oversight rather than serving as a one-time launch check.
- How deep it goes
- Describes systematic output review, stress-testing, and recurring safeguard adjustments, but does not specify monitoring metrics or implementation procedures.
- Examples
- Uses output review and stress-testing, and tracks disparities after systems connect to retrieval, tools, feedback, or new workflows.
- What you can do after
- Diagnose emerging failures and track whether unequal behavior appears, disappears, or worsens after deployment.

Terraform in Depth: Infrastructure as Code with Terraform and OpenTofu
Logging is the recording of application or infrastructure events and diagnostic information.
- How it is used
- Uses monitoring to trace state access and make provider failures understandable and actionable.
- How deep it goes
- Explains backend logging requirements and provider logging APIs, but defers backend-specific configuration details.
- Examples
- Uses backend access logs and a provider Configure function containing tflog.Debug, Diagnostics, and an unknown-token error.
- What you can do after
- Apply it via tflog and Diagnostics to produce traceable events and actionable provider errors without terminating Terraform prematurely.
Vibe Engineering
Monitoring is the continuous collection and examination of system behavior and operational measurements.
- How it is used
- Guides operational oversight of agent pipelines and AI-assisted development through behavior, cost, quality, and throughput measurements.
- How deep it goes
- Extends from metrics and dashboards to alert thresholds and response playbooks, without detailing monitoring implementation.
- Examples
- Uses a live agent pipeline dashboard and a monthly health check with cost, quality, satisfaction, and cycle-time thresholds.
- What you can do after
- Operate/configure monitoring dashboards and convert threshold breaches into investigations, audits, retrospectives, or tooling changes.
Context Engineering
Monitoring is the ongoing collection and examination of system signals and events to assess behavior and health.
- How it is used
- Tracks predefined signals to detect threshold breaches and captures agent activity for operational oversight.
- How deep it goes
- Distinguishes detection from explanation and names monitored signals, agent events, and state checkpoints.
- Examples
- Uses uptime, error rate, latency, resource utilization, prompts, memory retrievals, tool calls, and checkpoints as examples.
- What you can do after
- Operate agent systems by tracking infrastructure signals, agent events, and state checkpoints.
Also covered in
- Software Engineering for Data ScientistsIn early access (MEAP)
- Practical Automation with PowerShell: Effective scripting from the console to the cloud
- Designing Deep Learning Systems: A guide for software engineers
- Modern C, Third Edition
- Modern C
- AI Agents for Offensive SecurityIn early access (MEAP)
- Architecting an Apache Iceberg Lakehouse
- Learn AI Data EngineeringIn early access (MEAP)
- Infrastructure as Code, Patterns and Practices: With examples in Python and Terraform
- How Large Language Models Work
- Fight Fraud with Machine LearningIn early access (MEAP)
- Learn PowerShell in a Month of Lunches: Fourth Edition, Covers Windows, Linux, and macOS
What to know first
- language modelA language model is a computational model that represents patterns in linguistic sequences to assign probabilities, predict, generate, or evaluate language.
- performancePerformance is a measure of how effectively a person, process, model, or system achieves its objectives, including qualities such as output quality, speed, and resource efficiency.
- meanThe mean is a measure of central location equal to the arithmetic average of numerical observations, or the probability-weighted average of a random variable’s possible values.
- deployment pipelineA deployment pipeline is a repeatable sequence of stages that builds, tests or validates, packages, and delivers software changes toward release or deployment.
Related concepts
- observabilitypart of · Observability is the ability to infer a system’s internal state and behavior from its externally available outputs, such as logs, metrics, and traces.
- signalkind of · A signal is an observable value, pattern, event, or attribute that conveys information about a condition, behavior, or phenomenon.
- Where-Objectused by · Where-Object is a PowerShell cmdlet that filters pipeline objects according to specified properties, conditions, or criteria.
- lock monitoringincludes · Lock monitoring is the observation of lock-related activity, including blocked threads and the locks or monitors involved.
Questions about monitoring
What is monitoring?
Monitoring is the ongoing observation and measurement of a system or process to assess its behavior or condition and detect changes, failures, or other problems.
Which Manning books explain monitoring?
Troubleshooting Java, Second Edition, Machine Learning Platform Engineering, Cloud Observability in Action, Apache Kafka in Action, Effective Platform Engineering, Machine Learning System Design, LLM Evaluation and Alignment, The Foundational Ideas, Secure APIs and 43 more.
What should I know before learning monitoring?
Manning books that teach monitoring usually introduce language model, performance, mean and deployment pipeline first.
What kinds of monitoring are there?
Kinds of monitoring include black-box monitoring and lock monitoring.
What is monitoring a kind of?
Monitoring is a kind of signal. A signal is an observable value, pattern, event, or attribute that conveys information about a condition, behavior, or phenomenon.
What is monitoring part of?
Monitoring is part of observability. Observability is the ability to infer a system’s internal state and behavior from its externally available outputs, such as logs, metrics, and traces.
These guides are generated from the text of Manning books by Manning's knowledge graph and link to the sections they draw on. The full books are available on liveBook and at manning.com.