Monitoring makes live AI systems observable across the model and the engineering layers that deliver its predictions. A unified view helps teams catch performance regressions before users do and connect system behavior to the experience they receive. section 4.5 section 9.10.4
Track signals that reveal failures, changes, and user-facing costs:
- System performance: frontend rendering, API and feature-retrieval latency, model inference time, errors, timeouts, tool-call failures, and cost per request. section 4.5
- Evaluation pipeline health: prompt failures, timeouts, malformed outputs, model behavior, cost and latency, and result drift. section 9.10.4
- Live-test risks: translate failure modes and edge cases found offline into targeted watchpoints and alert thresholds. section 7.6
Set actionable thresholds
A team might alert when p95 end-to-end latency rises more than 20% above baseline, or when model inference errors exceed 1% of requests for five consecutive minutes. For a high-risk release, crossing a predefined threshold can reduce traffic, disable a feature flag, or roll back to the previous version. section 4.5
Figure 4.5 shows how user interaction flows through the frontend, backend, model inference service, and data layers, each contributing to overall system latency and user experience metrics. Metrics from every layer are collected and visualized in a unified dashboard, helping teams identify bottlenecks and evaluate the real-world performance of AI models. The diagram includes example tools like Lighthouse, Datadog, and TensorFlow Serving illustrate what technologies might be used at each stage.
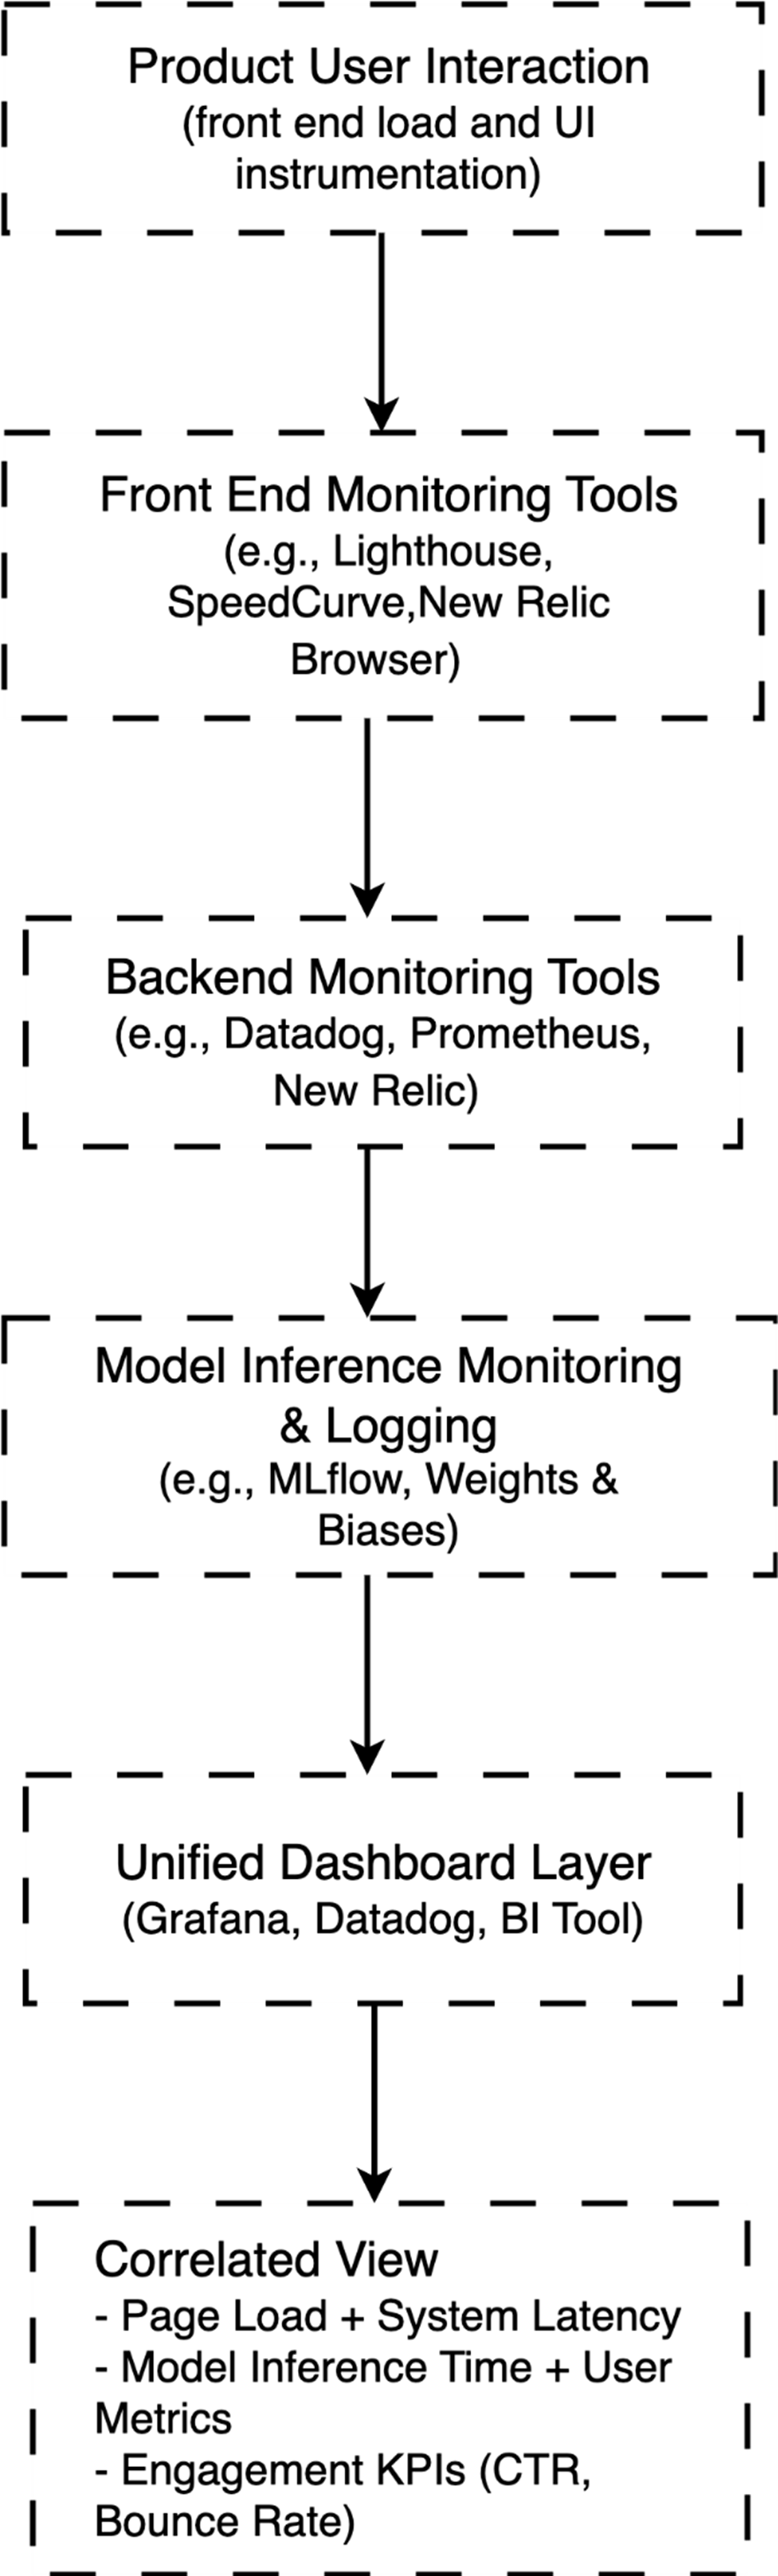
Use the diagram to see how metrics from the frontend, backend, inference service, and data layers can feed a unified dashboard. section 4.5