Monitoring helps teams understand whether distributed services behave correctly and perform reliably. Clear visibility supports faster diagnosis when services fail or users experience problems. section 2.4
OpenTelemetry can instrument, generate, collect, and export metrics, logs, and traces. Services send telemetry to centralized storage and aggregation for dashboards and other analysis tools. section 2.4.5
Monitoring addresses two complementary questions:
- Behavior: determine whether services perform the intended operations and call the correct services or infrastructure. section 2.4.5
- Performance: verify that services meet their Service Level Agreements and identify unusually slow responses. section 2.4.5
- Tracing requires service instrumentation so internal operations and their performance become visible. section 2.4.5
Application-level dashboard
Prometheus and Grafana can display domain-specific telemetry, such as the number of Approved and Rejected proposals over time. section 2.4.5
Figure 2.28 Aggregating observability from all our services in a single place reduces the cognitive load on the teams responsible for keeping the application up and running.
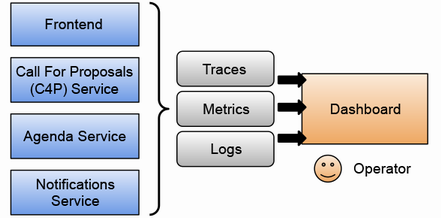
Use the centralized observability architecture to relate service telemetry to reduced operational cognitive load. section 2.4.5