A deployed model can keep serving requests while its predictions become less useful. Input data can change, responses can slow, and failures can appear under production load. Monitoring makes those changes visible so a team can investigate and act before they become prolonged service or business problems. section 2.1.6 section 11.1
Start by separating logs from metrics. Logs help debug application logic, reproduce edge cases, and investigate specific failures. Metrics answer aggregate questions: how many requests arrived, how long responses took, and how often requests failed. Dashboards make these trends visible; alerts notify people when a critical condition needs attention. Neither logs nor operational metrics alone establish that a model still performs well on live data. section 3.5 section 2.1.6 section 11.0
For an API-backed ML service, monitor two complementary layers:
- Service health: track CPU and memory utilization, throughput, response latency, and failing status codes. These measures help identify capacity problems, application errors, and risks to service level agreements. section 11.1.1 section 11.0
- Model behavior: examine incoming-data anomalies and drift, prediction performance, and errors or edge cases. Changing inputs or concepts can reduce effectiveness even when the API remains available. section 2.1.6 section 2.4
A practical service-health path is to expose a /metrics endpoint, have Prometheus scrape it, and query the resulting time series in Grafana. For a FastAPI application, PrometheusMiddleware and handle_metrics provide an example of endpoint instrumentation; the deployment must also be configured for scraping. Check Prometheus targets or service discovery before trusting a dashboard: a quiet chart may mean metrics are not being collected. section 3.5 section 11.1.1
Figure 3.17 Application 1 and Application 2 expose an endpoint for metrics. Prometheus scrapes those metrics, which are then visualized by Grafana. Alertmanager uses those metrics to check if any alerts need to be routed to a channel; in this case, it’s an email.
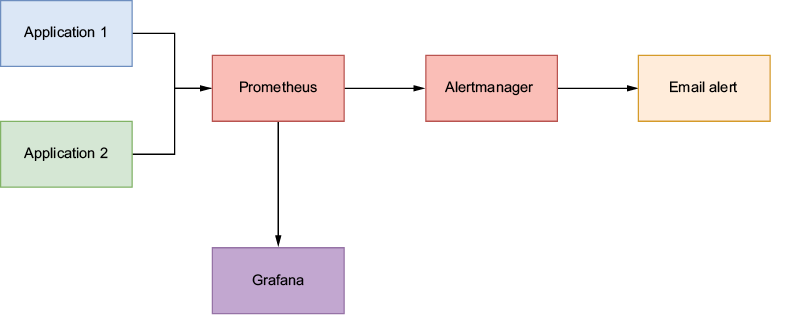
The diagram connects application metrics endpoints to Prometheus scraping, Grafana visualization, and Alertmanager notification routing. section 3.5
For BentoML deployments, use the built-in /metrics endpoint and verify that Prometheus discovers and scrapes the deployment. A prebuilt Grafana dashboard supplies basic service monitoring; custom metrics can extend it. Collect logs alongside those charts so an alert about slow or failing requests leads to evidence useful for debugging the incident. section 11.1.1 section 11.0
Monitor drift without testing every request
For an income-classification API, compare recent requests with a reference dataset using Evidently. A monitoring service accumulates requests into a window, generates a drift report when enough new rows arrive, and evicts older rows as the window advances. Comparing a reference dataset with one request would produce an unreliable test; the appropriate window size depends on the application. section 6.2.3 section 6.0
Monitoring closes a loop rather than ending at a dashboard. Use detected errors or drift to investigate data, fix defects, collect edge cases, refine features, or retrain and replace a model. Model versions provide context when relating a change in behavior to a deployment. Where appropriate, performance falling below a threshold can trigger an automated pipeline—but the signal must be meaningful before automation acts on it. section 2.1.7 section 2.1.6 section 1.1.2