liveBook · Manning

Interval

As explained in Effective Data Analysis

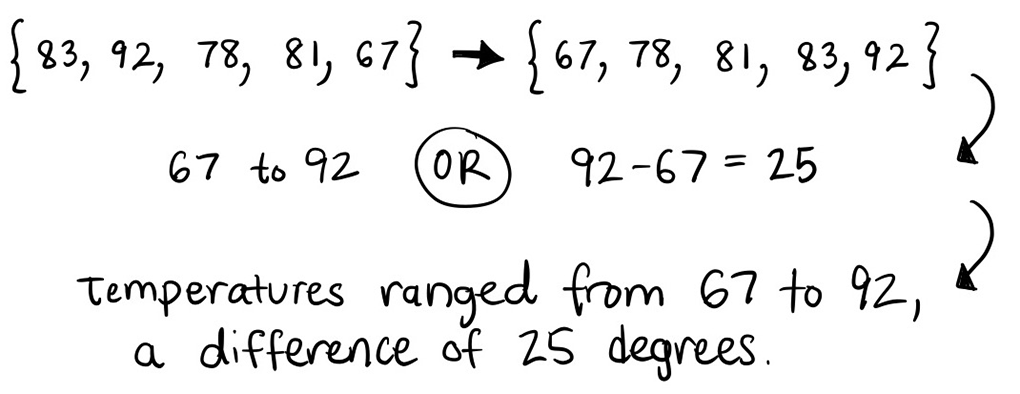
The range is the difference between the highest and lowest values in a dataset, sometimes reported together with both endpoints.

An interval, or range, is the difference between the highest and lowest values in a dataset. It describes the dataset’s entire width. section 4.1.1 section 4.1.2

Use the range as one part of a broader descriptive summary:

  • Pair it with the median and interquartile range when a dataset has no meaningful center. section 4.1.2
  • Compare it with measures such as the mean, median, standard deviation, and interquartile range, since each highlights different dataset properties. section 4.1.2
  • Check the dataset’s shape and assumptions before reporting the range or using it to characterize the data. section 4.1.2
Figure 4.12 The range depicts the entire width of the dataset.
figure

The figure depicts the range as the full horizontal width covered by the dataset. section 4.1.1

How Effective Data Analysis covers it

How deep it goes
Defines range as dataset width and situates it among summary statistics, without developing an extended computational procedure.
Examples
Uses a figure showing the range as the entire width of a dataset.
What you can do after
Evaluate dataset width alongside other summary statistics and report it cautiously when the distribution lacks a meaningful center.
How it connects
Connects range with median, interquartile range, mean, standard deviation, and distribution shape.

Also explained in

Compare how 7 books explain interval →

Related concepts

This explainer was generated by Manning's knowledge graph from the text of Effective Data Analysis. The section links point to the parts of the book it draws on.