A ratio makes review data easier to compare by expressing each category’s positive or negative reviews relative to the category total. This simple measure can reveal strengths and weaknesses that raw counts may hide. section 4.4
A practical ratio workflow is to:
- Group review counts by product category and review type. section 4.4
- Divide each count by the total count for its product-category group. section 4.4
- Compare the resulting positive and negative shares alongside the original counts. section 4.4
- Check the pattern against the underlying records before treating it as evidence of customer satisfaction or market fit. section 4.4
Review ratios by product group
For Auto & Accessories, 965 negative reviews out of the group total produce a negative share of 0.229053, while 3,248 positive reviews produce 0.770947. A grouped bar chart can show counts, with a second-axis line displaying negative-review ratios. section 4.4
Figure 4.4 Grouped bar plot showing aggregated review score counts by product categories aggregated into product groups, with a line indicating the ratio of negative reviews to positive
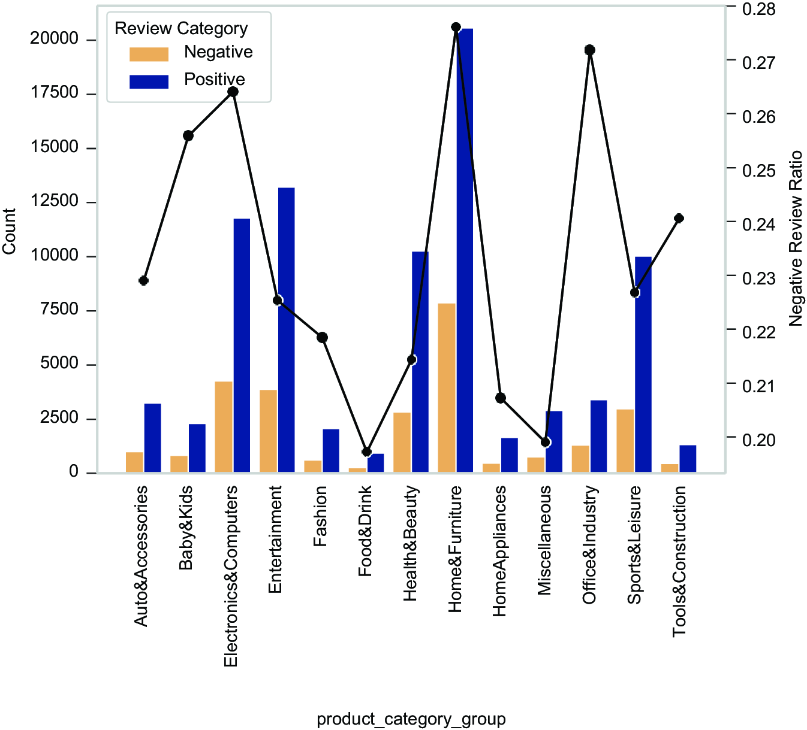
Use the combined chart to compare review volume with the relative share of negative reviews across product groups. section 4.4