The RED method is a monitoring philosophy for microservices that focuses service health on request rate, error rate, and request duration. It narrows a potentially overwhelming metric set into measures that support API performance decisions. section 11.2 section 11.2.1
Measure each service through three complementary views:
- Request rate, or throughput, counts requests processed during a time window such as a second, minute, week, or month; longer windows reveal usage trends. section 11.2.1
- Error rate, or failure rate, counts failed requests over time. Track 4xx user errors and 5xx server errors, investigate context in logs, and alert the API team when thresholds are exceeded. section 11.2.1
- Duration, or request latency, measures the time from request to response. Gateway-level averages can hide bad endpoints, so compare endpoint-level percentiles as well. section 11.2.1
Interpreting RED signals
A regional spike in 401 Unauthorized responses may indicate malicious actors or bots, while application logs can identify the infrastructure or application component behind 5xx errors. A latency chart comparing the 90th percentile for /messages/:id and /groups/id exposes endpoint differences that an overall average could conceal. section 11.2.1
Figure 11.26 Example latency chart in Moesif, tracing the 90th percentile latency of two endpoints /messages/:id and /groups/id
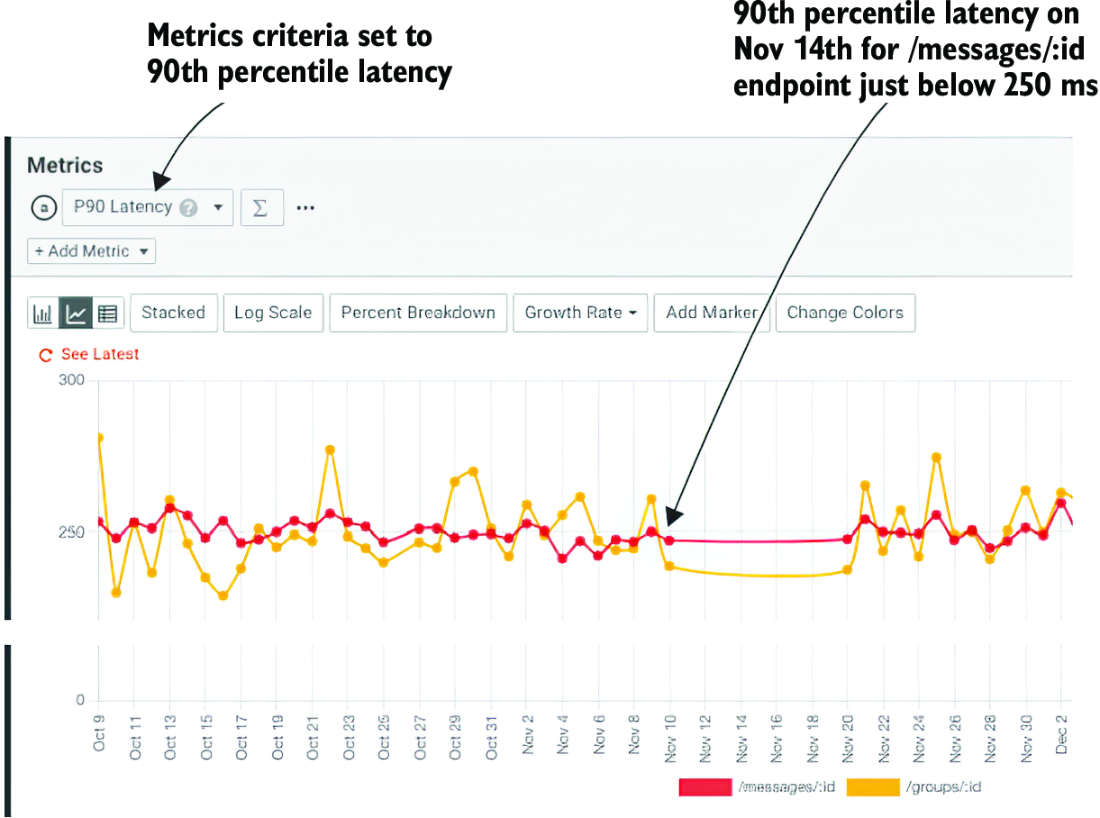
Use the latency chart to compare 90th-percentile performance between individual endpoints rather than relying on an aggregate average. section 11.2.1
