Residual analysis examines sample-level differences between model predictions and ground truth to reveal error patterns that a single loss or metric conceals. In regression, a residual is predicted value minus true value; more broadly, it can be any prediction error aligned with the task’s loss. section 9.2 section 9.2.1
Use residual analysis to:
- Check model assumptions, prediction bias, and whether residuals show an unexpected distribution. section 9.2.1
- Locate samples and data subsets responsible for metric changes or the largest number of errors. section 9.2.1
- Compare residual distributions across cohorts to identify skew or possible fairness disparities. section 9.2.1
- Study best cases, worst cases, and corner cases such as extreme histories, prices, session lengths, or inventory levels. section 9.2.1
A practical review loop
After training a candidate model, sample roughly 100 high-loss or high-metric-error results. Attach useful metadata, propose a short explanation for each unusual result, and group samples by recurring hypotheses such as blurry images, overoptimized descriptions, or overly short queries. Revisit the analysis whenever system improvements are planned. section 9.4.2
Figure 9.8 Basic case: single regressor x. Each vertical line represents a residual error (e) or, simply, residual. Lines above the regressor have negative signs (the actual value is higher than the predicted value), and lines below the regressor have positive signs.
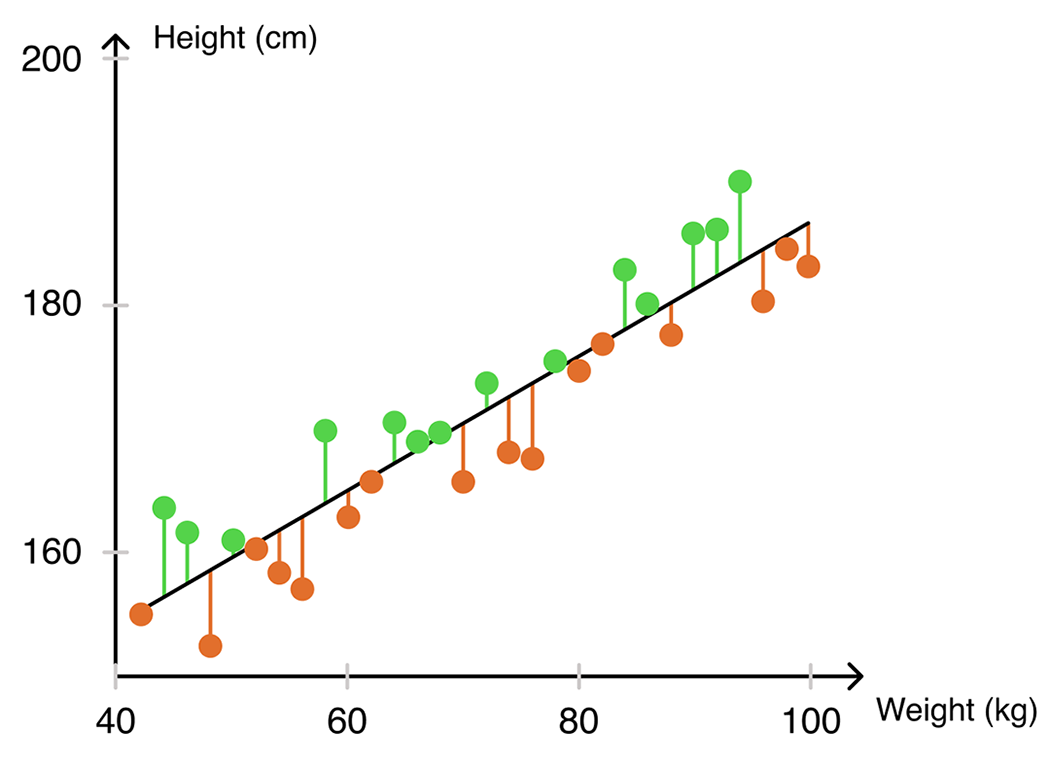
A residual plot makes the sign and size of each prediction error visible: each vertical segment connects a predicted value with its actual value. section 9.2
