A ground-truth model generates data from relationships and parameter values treated as known. It lets you test an analysis against a correct answer before applying the method to situations where the answer is unknown. section 6.1.1
Build a ground-truth analysis by:
- Drawing the relevant variables and arrows between variables that affect one another. section 6.1.1
- Generating synthetic observations from specified relationships, parameters, and random errors. section 6.1.1
- Estimating effects with a candidate method and comparing its results with the known parameters. section 6.1.1
Hotel pricing
Generate 1,000 observations for distance, price, and customers. Set price to decrease with distance and customers to decrease with both price and distance, then test regressions. Adjusting for distance recovers effects near the known values, whereas an unadjusted relationship can reverse direction through Simpson’s paradox. section 6.1.1
Figure 6.1 Graph illustrating the data-generation process for creating synthetic data, as described in the example. The arrows in the graph are labeled with their corresponding linear coefficients, all of which are negative, as this fits the context of the data modeled.
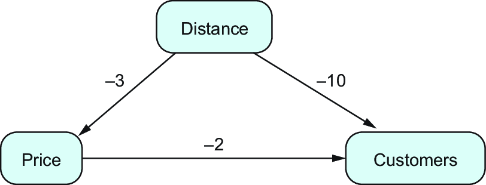
Use the data-generation graph to inspect the variables, directed relationships, and coefficients before simulating observations. section 6.1.1
