A service-level indicator (SLI) is a quantitative metric of a service’s reliability or performance from the user’s perspective. Typical SLIs include response latency, throughput, error rate, and availability. An SLI measures current behavior; a service-level objective (SLO) sets a target for that behavior, while a service-level agreement (SLA) formalizes customer commitments and consequences. section 5.4 section 10.4.1
Use SLIs to connect operational measurement with reliability work:
- Choose measures that reflect customer experience and business priorities rather than collecting metrics without a decision context. section 5.4 section 10.4.2
- Automate collection and make the measurements visible so platform teams can track service health and investigate problems. section 5.4 section 5.4.1
- Pair each important SLI with an SLO, then use error budgets to balance change velocity against reliability. section 10.4.1 section 10.8
Platform API latency
If a custom platform API consistently responds in 200 milliseconds, response time is an SLI. An associated SLO might require responses within 200 milliseconds for 99.9% of requests. A breach prompts investigation and remediation; an enterprise SLA may additionally specify compensation. section 5.4
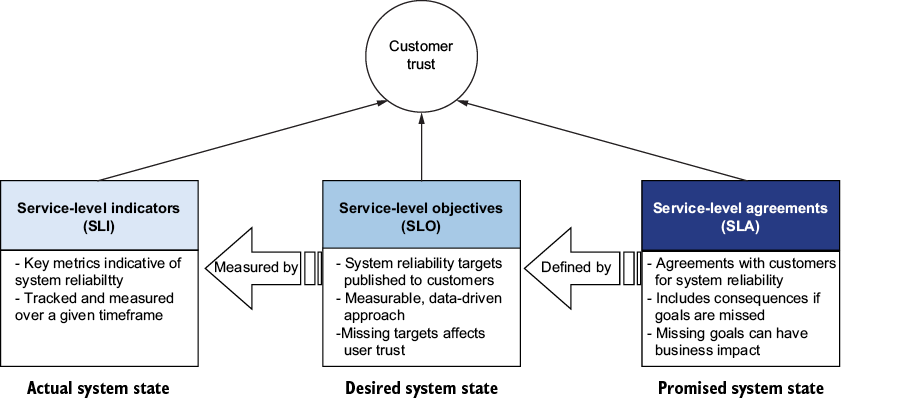
The relationship diagram shows how measured SLIs inform SLOs, which can support notifications and published SLAs. section 5.4


