Inference runs a trained machine-learning model to produce outputs from inputs. For large models, the deployment bottleneck is often moving weights and activations through memory rather than performing arithmetic. Low GPU utilization can therefore coexist with high memory-bandwidth demand, latency, and power consumption. section 1.0
Quantization reduces the bits used to represent weights and activations, commonly moving from 16-bit or 32-bit floating point to 8-bit or 4-bit integers. It reduces storage and data movement without changing model structure. The gain depends on whether the target runtime and hardware actually execute the low-precision computation rather than falling back to full precision. section 1.0 section 10.0
For CPU language-model inference, each generated token reads the weight matrix from DRAM through cache, making weight layout consequential for memory footprint and token throughput. CPU deployment can still be attractive when a GPU is unavailable or a separate GPU fleet adds operational cost; compare the actual workload and prices rather than token speed alone. section 10.1
Compare cost per generated token
At full single-stream utilization, cost per million tokens is hourly instance price × 1,000,000 ÷ (tokens per second × 3,600). For Llama-2-7B Q4_K_M with llama.cpp, a $1.1088/hour CPU instance at about 20 tokens/s costs $15.40 per million tokens. A $0.7068/hour NVIDIA L4 instance at an estimated 50 tokens/s costs about $3.93 per million. The GPU throughput is an estimate; cloud CPU measurements vary. section 10.1
Figure 10.1 Effective cost per million Llama-2-7B Q4_K_M tokens versus sustained demand, on Google Cloud c3-standard-22 (CPU-only, solid) and g2-standard-4 with one NVIDIA L4 (dashed) in us-central1 at on-demand list pricing. Each curve declines hyperbolically until the instance's single-stream throughput ceiling (CPU at 20 tok/s, GPU at 50 tok/s; tick marks at successive replica boundaries), then steps up as additional replicas absorb demand above ceiling. Below saturation the ratio between curves equals the ratio of hourly prices (1.57×). At the GPU's saturation the ratio is roughly 3.9×, widening further at higher demand because the CPU instance saturates at 2.5× lower throughput. The L4 wins on cost per token at every demand point in the plot; the gap is bounded between 1.57× and roughly 5×.
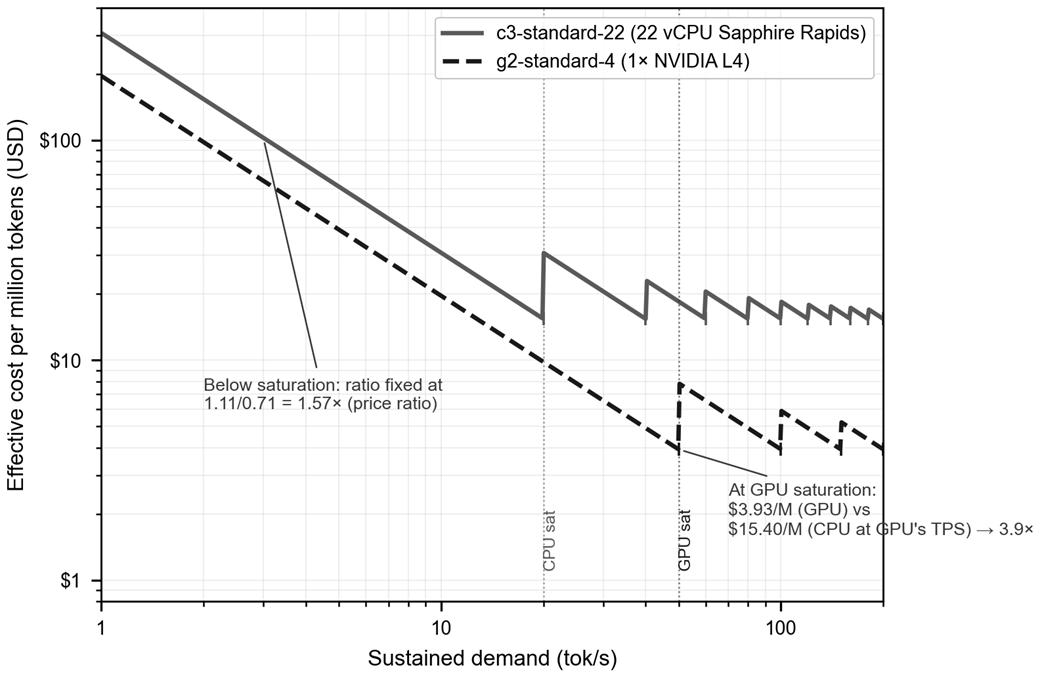
Compare effective cost across demand levels, including the steps introduced by additional replicas. section 10.1
Validate inference on the deployment path:
- Check that quantized execution actually occurs. For GGUF, the runtime is llama.cpp rather than an ONNX graph executor; GGUF quantization schemes do not map onto operator-level INT8 dispatch. section 10.0
- Measure throughput on the target hardware and workload. Quantization choice, build flags, and thread count can silently leave CPU throughput on the table. section 10.0
- Measure what the user waits on, not only inference time. State measurement conditions and leave unavailable measurements unreported rather than guessing. section 12.4