An SMA crossover strategy generates trading signals by comparing simple moving averages over different time windows, such as a 200-day SMA and a 5-day SMA. section 10.1.3
A programmer can extend the basic crossover logic by:
- Replacing direct SMA comparisons with reusable isBuySignal and sell-signal methods. section 11.3.2
- Combining quantifiable signals such as price movement, keyword sentiment, insider activity, and technical indicators. section 11.3.2
- Screening signals daily or at shorter intervals while considering broader events that may affect assets. section 11.3.2
Figure 10.13 A NuScale (SMR) chart provided by Finviz.com shows how quickly we can perceive price movements over a longer time when the details are visualized.
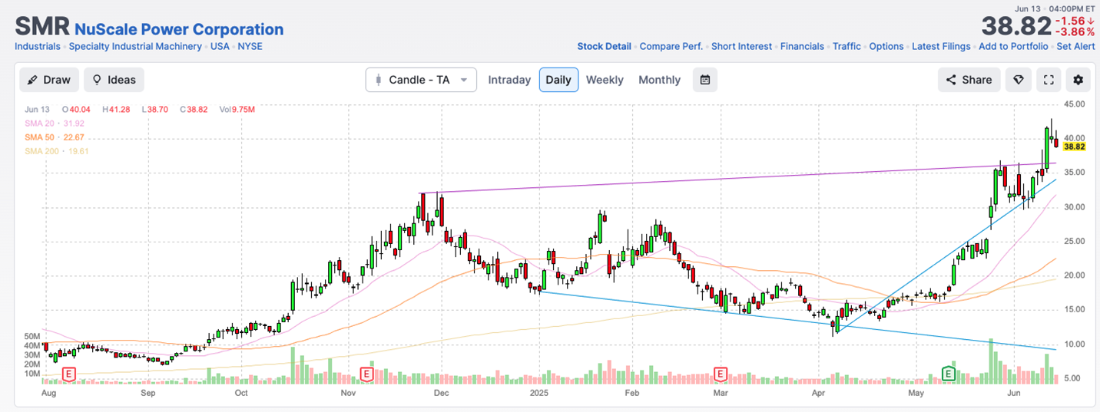
Use the chart to inspect longer-term price movement and relate visual momentum to different trading horizons. section 10.1.3
