liveBook · Manning

Stack trace

As explained in Build Applications with Local AI Models on a Mac

A Python diagnostic report showing the sequence of calls leading to an exception and where it occurred.

A Python stack trace, also called a traceback, is a diagnostic report showing the calls leading to an exception and where it occurred. section 18.1

Use the traceback as part of a systematic debugging process:

  • Read it, isolate the problem, form a hypothesis, and test a fix. section 18.1
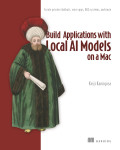
How Build Applications with Local AI Models on a Mac covers it

How deep it goes
Connects reading tracebacks with isolating problems, forming hypotheses, and testing fixes, without detailing traceback internals.
What you can do after
Diagnose/debug with tracebacks by isolating problems, forming hypotheses, and testing fixes.
How it connects
Connects tracebacks with Python scripts and systematic debugging.

Also explained in

Compare how 7 books explain stack trace →

Related concepts

This explainer was generated by Manning's knowledge graph from the text of Build Applications with Local AI Models on a Mac. The section links point to the parts of the book it draws on.