A stack trace is a breadcrumb trail of active method calls showing how execution reached a particular point. It typically identifies methods, classes, and source lines, making the current execution path easier to follow than code reading alone. section 2.2.1 section 2.2
Use a stack trace to investigate:
- Which methods called the method under investigation, especially in a large or unfamiliar codebase. section 4.1.2
- Where framework-managed or aspect-based logic enters the execution chain and changes behavior that is not visible in the nearby code. section 2.2.1
- Whether an exception location is merely a consequence rather than the root cause; investigate earlier calls before applying a local fix. section 4.1.1
- What each thread was executing, waiting for, or blocking when a thread dump was captured. section 8.2.1
Tracing an unexpected method call
Suppose Main calls ProductController.saveProduct("Beer"), which calls ProductService.saveProduct(name). The expected output is "Saving product Beer", but the application prints "Saving product Chocolate". Reading the call sites suggests the value should remain unchanged. The stack trace reveals an aspect in the execution path, and the aspect calls proceed with "Chocolate" instead. The trace therefore exposes hidden logic rather than merely identifying the final line.
Capture and read the trace in several ways:
- Inspect it when a debugger pauses at a breakpoint; use the frames to navigate backward through the calling path while checking variables in scope. section 2.2
- Log it with a non-blocking breakpoint to observe execution without pausing the application or modifying its code. section 3.2
- Print new Exception().printStackTrace() inside a method when a debugger is unavailable; this records the callers without throwing the exception. section 4.1.2
- Read exception stack traces in logs as evidence of where execution encountered trouble, not automatic proof of the root cause. section 4.1.1
Figure 2.8 The top layer of the execution stack trace is where the debugger paused the execution. All other layers in the execution stack trace are where the methods represented by the above layers were called. The bottom layer of the stack trace (the first layer) is where the execution of the current thread began.
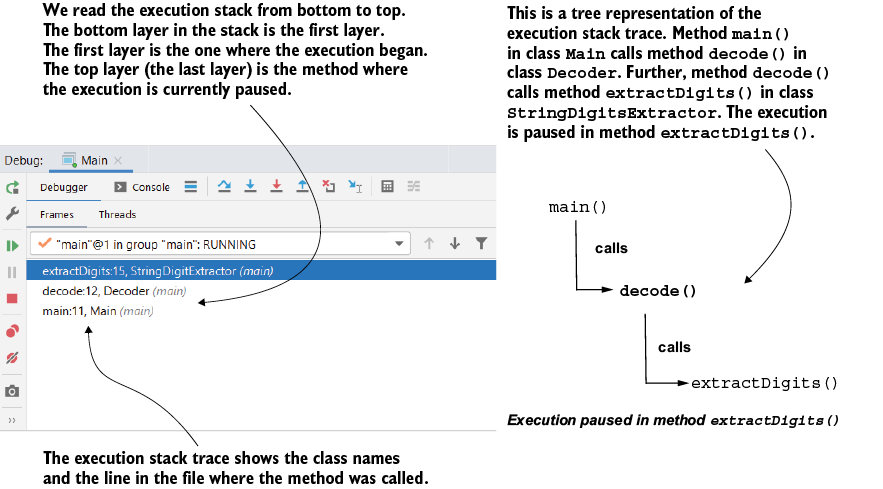
Follow the diagram from the thread’s starting frame at the bottom to the paused execution point at the top; intermediate frames show the calls between them. section 2.2.1