Standard error estimates sampling variability by indicating how close a sample mean is likely to be to the corresponding population mean. section 4.1.1 section 4.1.2
Use it alongside other summary statistics rather than as a complete description of a dataset. Standard deviation describes variation among records; standard error addresses the sample mean’s relationship to the population mean. section 4.1.1 section 4.1.2
Apply standard error with these checks:
- Check the distribution’s assumptions before reporting the value or using inferential statistical tests. section 4.1.1 section 4.1.2
- Explain error bars explicitly: unspecified bars can misrepresent the data and confuse stakeholders about whether they show standard error or another quantity. section 4.1.1
- Interpret the measure with the distribution’s shape and other statistics, since every summary statistic emphasizes some properties while masking others. section 4.1.2
Figure 4.3 The shape of a distribution can vary widely, and different summary statistics will give you clues about those shapes.
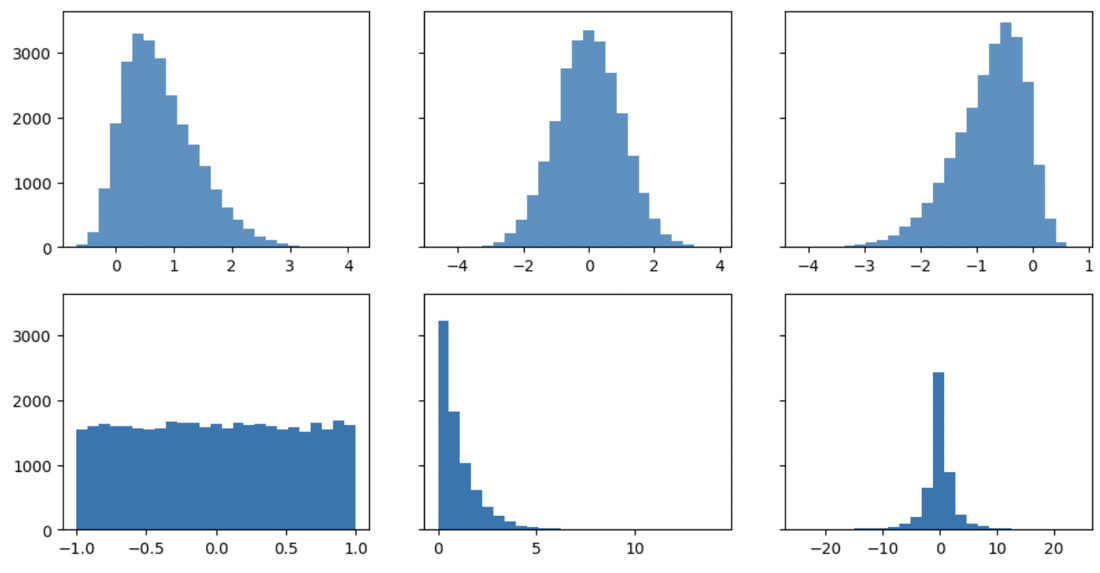
Compare distribution shapes before interpreting standard error or other summary statistics; similar centers can conceal substantially different underlying data. section 4.1.1

