A lender receives an 8% predicted probability of default. That score does not, by itself, say whether to approve the loan. The strategy and monitoring layer turns model outputs into operational decisions by applying business objectives, risk appetite, policies, regulatory constraints, and current conditions. section 4.3.3 section 7.4.4
A practical decision workflow is:
- Set action thresholds. In fraud detection, a score below 0.2 might mean auto-approval, 0.2–0.7 might require authentication or analyst review, and above 0.7 might mean decline or urgent investigation. These are example bands, not universal cutoffs. section 7.4.4
- Apply policy before acting. A proposed 28% APR cannot stand where a local rate cap is 25%; the decision must respect the cap. section 4.3.3
- Adjust strategy as conditions change. Negative macroeconomic signals can justify tighter acceptance criteria or lower credit limits; observed fraud rates and false positives can prompt threshold recalibration. section 4.3.3 section 7.4.4
- Monitor results. Dashboards, stability checks, early delinquency tracking, drift detection, alerts, and A/B tests help identify when a model audit or more conservative strategy is warranted. section 4.3.3
The layer sits between prediction and execution in a four-layer system. The data asset layer prepares inputs, the modeling layer produces signals, and the application layer carries out actions. For an investment application, strategy and monitoring owns backtesting and risk controls, while the application layer executes live trades. section 10.1.1 section 7.4
Governance remains part of the design as systems become more autonomous. When agents propose actions, human-in-the-loop approval joins A/B testing and performance metrics in this layer; the agent executor belongs to the application layer. section 14.1.2
Figure 4.6 In the strategy and monitoring layer, domain metrics, regulatory checkpoints, dynamic thresholds, and real-time monitoring converge to govern how model outputs are applied. By defining policies—such as rate caps or acceptance floors—institutions can respond quickly to changing market conditions or compliance updates. Drift detection, A/B testing, and automated alerts help maintain consistent performance and reduce risk as credit portfolios evolve.
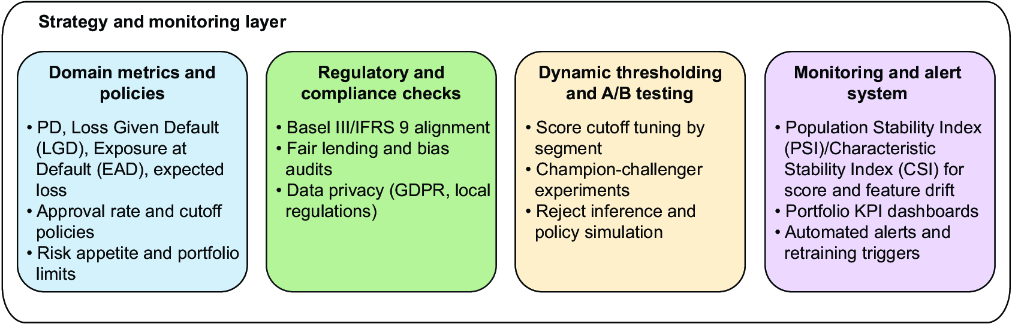
The diagram brings together policy checkpoints, dynamic thresholds, domain metrics, and monitoring around the decision made from a model output. section 4.3.3
