The support of a probability distribution is the range of values that can occur with positive probability. For causal comparisons, compare the supports of propensity-score distributions for treated and untreated patients: overlap identifies patients with comparable treatment possibilities. section 5.3.3
Use support overlap to determine which causal effects are identifiable:
- No overlap means there are no matches, so an average treatment effect cannot be calculated. section 5.3.3
- Partial overlap restricts the average treatment effect to patients inside the common-support region. section 5.3.3
- Full overlap is the ideal setting for calculating average treatment effects. section 5.3.3
Figure 5.11 Partial overlap in a distribution’s supports. We can calculate the ATE only for patients within the common support region.
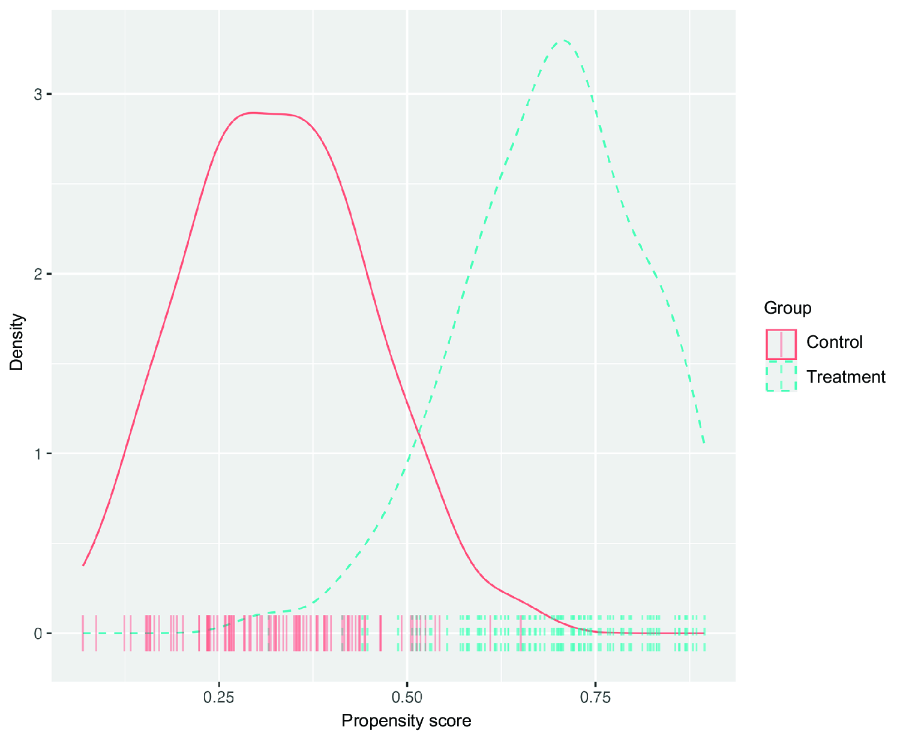
The partial-overlap diagram makes the common-support restriction visible: causal effects are estimated only where treated and untreated propensity-score distributions overlap. section 5.3.3

