A support line is a price level where buying pressure tends to impede further declines. Analysts treat it as an interpretation of market data, not a guaranteed floor. section 10.1.2
For example, a proposed Bitcoin support line at $72,000 means analysts consider a fall below that level unlikely unless an external event intervenes. A price crossing support or resistance is a breakout. section 10.1.2
Support and resistance can also reflect investor psychology: traders may buy near perceived support, while sellers may appear near perceived resistance. The Ichimoku Cloud extends this idea by displaying dynamic support or resistance alongside trend and momentum. section 10.1.2 section 10.2.3
Figure 10.24 An Ichimoku for NVIDIA closing prices indicating multiple bullish moments
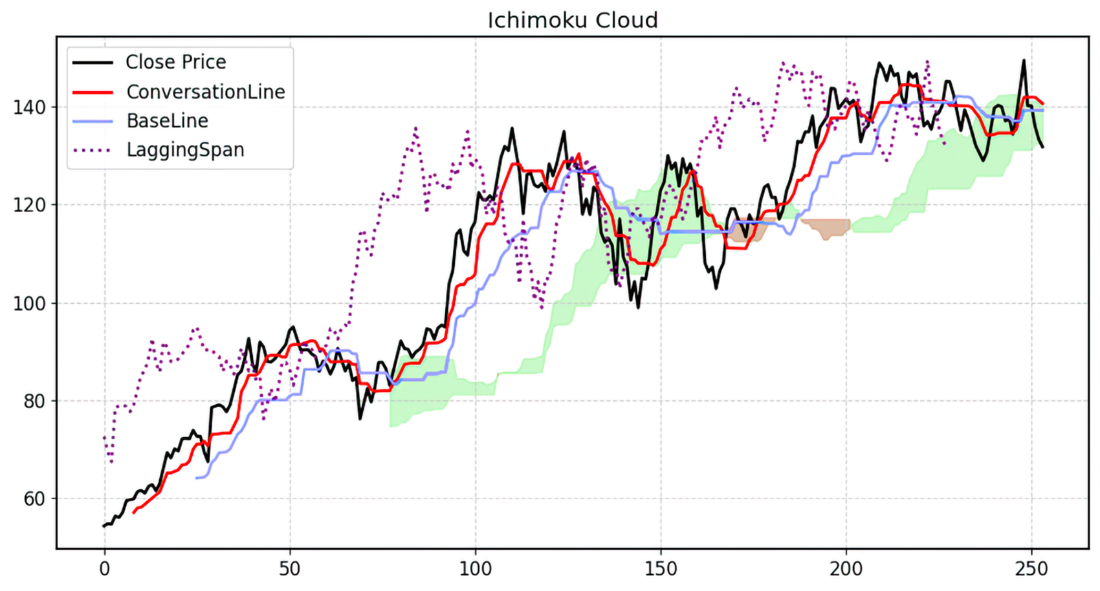
Use the NVIDIA Ichimoku figure to see support represented dynamically through the cloud rather than as one fixed price. section 10.2.3
