Efficiency measures dollars spent on player salaries for each regular season win, making payroll a directly interpretable investment metric. section 11.4.2
Use efficiency to compare NBA teams across 2000–2017:
- Lower values indicate better efficiency because fewer salary dollars produced each regular season win. section 11.4.2
- A horizontal bar chart sorts teams from most efficient to least efficient and labels each bar with average wins. section 11.4.2
- Inflation-adjusted payroll and wins provide context for identifying outliers such as the Spurs and Knicks. section 11.4.2
The Spurs as an efficiency benchmark
The San Antonio Spurs averaged more regular season wins than every other team while spending less than $1.5 million in player salaries per win; the Knicks showed the opposite pattern. section 11.4.2
Figure 11.2 Spend on player salaries for every regular season win between 2000 and 2017, sorted from top to bottom between most efficient to least efficient
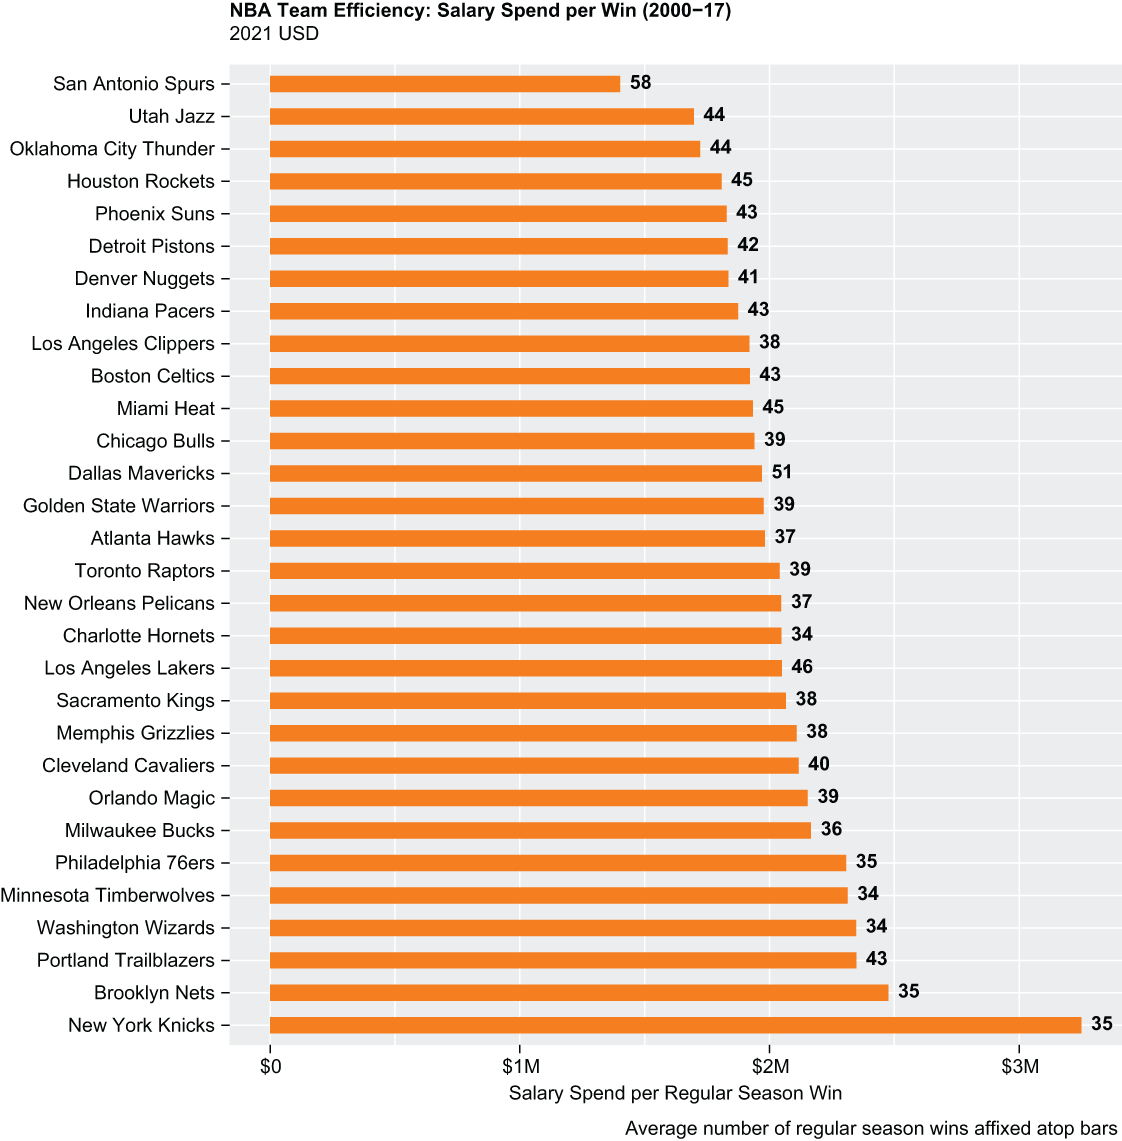
Compare team salary spend per regular season win in a sorted horizontal bar chart. section 11.4.2
