A team payroll is the total player-salary spending by one team for a season. It counts money paid by the team to players, not endorsement income or other outside earnings. In NBA analysis, payroll can be kept in the season’s actual dollars or adjusted to 2021 dollars so that spending is comparable over time. section 10.0 section 10.3
Payroll turns a familiar sports question into a measurable one: do higher-spending teams achieve more? Team accomplishment can be tracked through regular-season wins, playoff qualification, and championships. Across the 2000–2017 seasons, payroll and wins show a positive, statistically significant association, but that association does not by itself establish causation. section 10.0 section 10.4.1 section 10.5
Prepare team payroll data for useful comparisons:
- Import payrolls alongside wins and postseason-result fields; account for missing values caused by the league having 29 teams in earlier seasons. section 10.2
- Compute league average payroll by season, then pivot yearly salary columns from wide to long form for time-series charts. section 10.3
- Rank teams by real-dollar payroll and color each team by no playoffs, made playoffs, or won title. section 10.4.2
- Group inflation-adjusted payrolls by postseason result to compare average spending across outcome categories. section 10.4.3
Comparing payroll with performance
For 2000, the payroll-to-wins Pearson correlation is 0.57. Repeating the calculation season by season produces correlations ranging from 0.02 in 2006 to 0.57 in 2000. A scatterplot places payroll on one axis and wins on the other, with postseason status shown by color; a fitted line makes the overall relationship easier to inspect. section 10.4.1
Outcome comparisons sharpen the question. From 2000 through 2017, inflation-adjusted average payroll was about $78M for teams missing the playoffs, $85M for playoff teams that did not win a title, and $88M for champions. A championship value represents one team’s payroll in each season, so it should be interpreted more cautiously than the larger group averages. section 10.4.3
Payroll can also be treated as an investment measure rather than a total-spending measure. Standardizing adjusted payroll and wins allows their gaps to be compared team by team, while salary spend per regular-season win provides a direct efficiency ranking. section 11.4.2
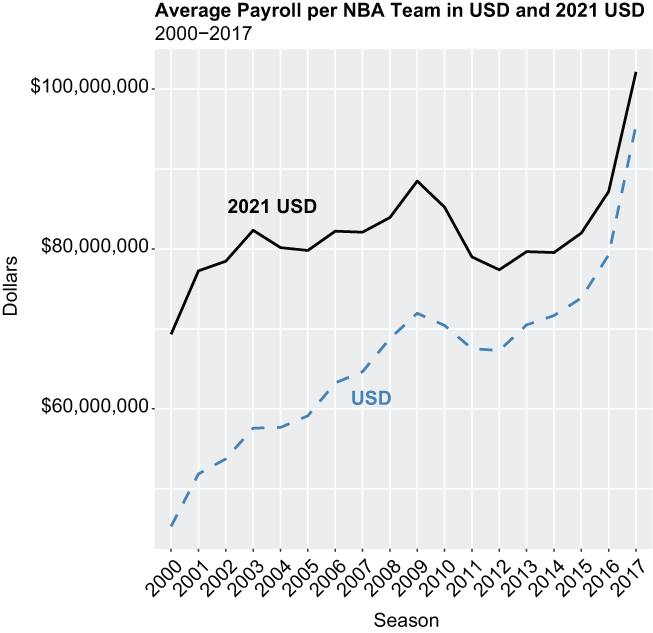
Compare average NBA team payroll in actual and inflation-adjusted dollars from 2000 through 2017 before drawing conclusions from changes in spending. section 10.3
