Test data is deliberately generated or collected to exercise a system and populate a visualization before real data exists. It supports prototyping without pretending that nonexistent values are real findings. section 9.1.2
Create test data in a shape that resembles the eventual production flow:
- Perform the real action in a safe test context, such as answering a survey, clicking buttons, or using a fake payment method. section 9.1.2
- Locate where the resulting data lands, such as a database table, API output, or another destination. section 9.1.2
- Connect the visualization tool to that source, or export the data once and load it into the visualization. section 9.1.2
A small survey dataset
Two respondents can supply ratings for app recommendations, overall app quality, and breakfast enjoyment. Even a tiny dataset can help populate and test a prototype before the full survey runs. section 9.1.2
Figure 9.6 How you generate and access test data to populate your prototypes will depend heavily on the tech stack being used to collect, store, clean, and serve up the data between generation and visualization.
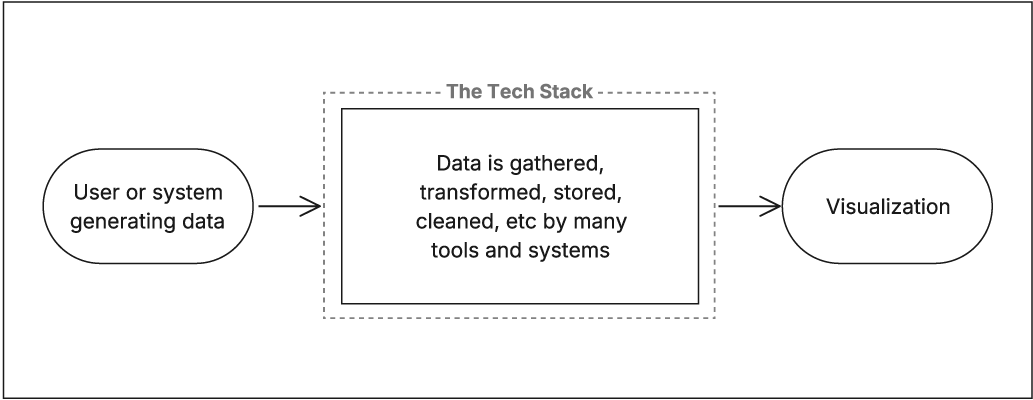
Trace test data from generation through collection, storage, cleaning, and delivery to the visualization; the route depends on the technology stack. section 9.1.2