Test error measures how well a model predicts examples kept in a testing set. It estimates whether the model captures the dataset’s pattern rather than memorizing training examples. section 4.2
Compare test error with training error to recognize model behavior:
- A large test error suggests underfitting when training error is also large. section 4.2
- A small test error indicates a model that fits both training and testing examples well. section 4.2
- A large test error paired with a tiny training error suggests overfitting. section 4.2
Choosing among polynomial models
For models of degrees 1, 2, and 10, training error falls as complexity increases, but test error first falls and then rises. The degree-2 model is preferred because it has low test error. section 4.2 section 4.16
Figure 4.4 We can use this table to decide how complex we want our model. The columns represent the three models of degree 1, 2, and 10. The rows represent the training and the testing error. The solid circles are the training set, and the white triangles are the testing set. The errors at each point can be seen as the vertical lines from the point to the curve. The error of each model is the mean absolute error given by the average of these vertical lengths. Notice that the training error goes down as the complexity of the model increases. However, the testing error goes down and then back up as the complexity increases. From this table, we conclude that out of these three models, the best one is model 2, because it gives us a low testing error.
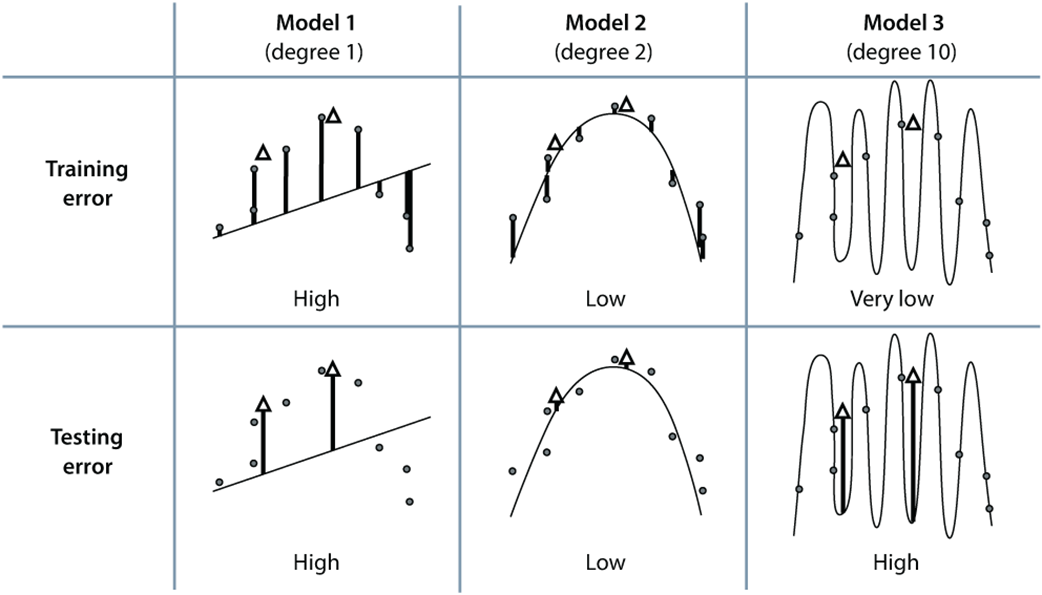
Use the figure to compare training and testing errors visually; vertical distances represent absolute prediction errors, averaged as mean absolute error. section 4.2

