A data survey is a fast, structured inspection of available data resources. It checks whether the expected data exists, where it resides, how it can be accessed, and whether obvious integrity problems could obstruct the project. It is a checkpoint before deeper exploratory data analysis (EDA), not a substitute for it. section 4.5 section 5.2 section 5.2.1
Start with the data story: the customer’s account of how the data was produced and what it contains. Treat its claims as hypotheses to check, not technical facts. Once the team has access, survey broadly with inexpensive inspections and queries. Use the results to choose where deeper EDA effort is warranted. section 4.5 section 5.2.1
Make the survey an explicit sprint ticket:
- Inventory relevant resources and tables; record attributes, scale, time period, record counts, and fresh sample records. section 5.2 section 5.2.5
- Check completeness, coverage, and quality. Count nulls and zero values, investigate known integrity concerns, and test suspected bias, poisoning, or labeling problems where applicable. section 5.2 section 5.2.5
- For unstructured resources, inspect samples and empty or placeholder records to locate potential problems; leave time-consuming, deeper investigation to EDA. section 5.2.4
- Write up findings, review them with the team, and flag project-threatening problems to the client and risk register. section 5.2 section 5.2.5
A sensor-data check
Suppose a building changed sensor design after its first year. Count temperature readings, nulls, and zero values, then compare missing values by year. If nulls cluster in the year of the change, investigate the cause before modeling; that year’s data may need to be excluded. section 5.2.2
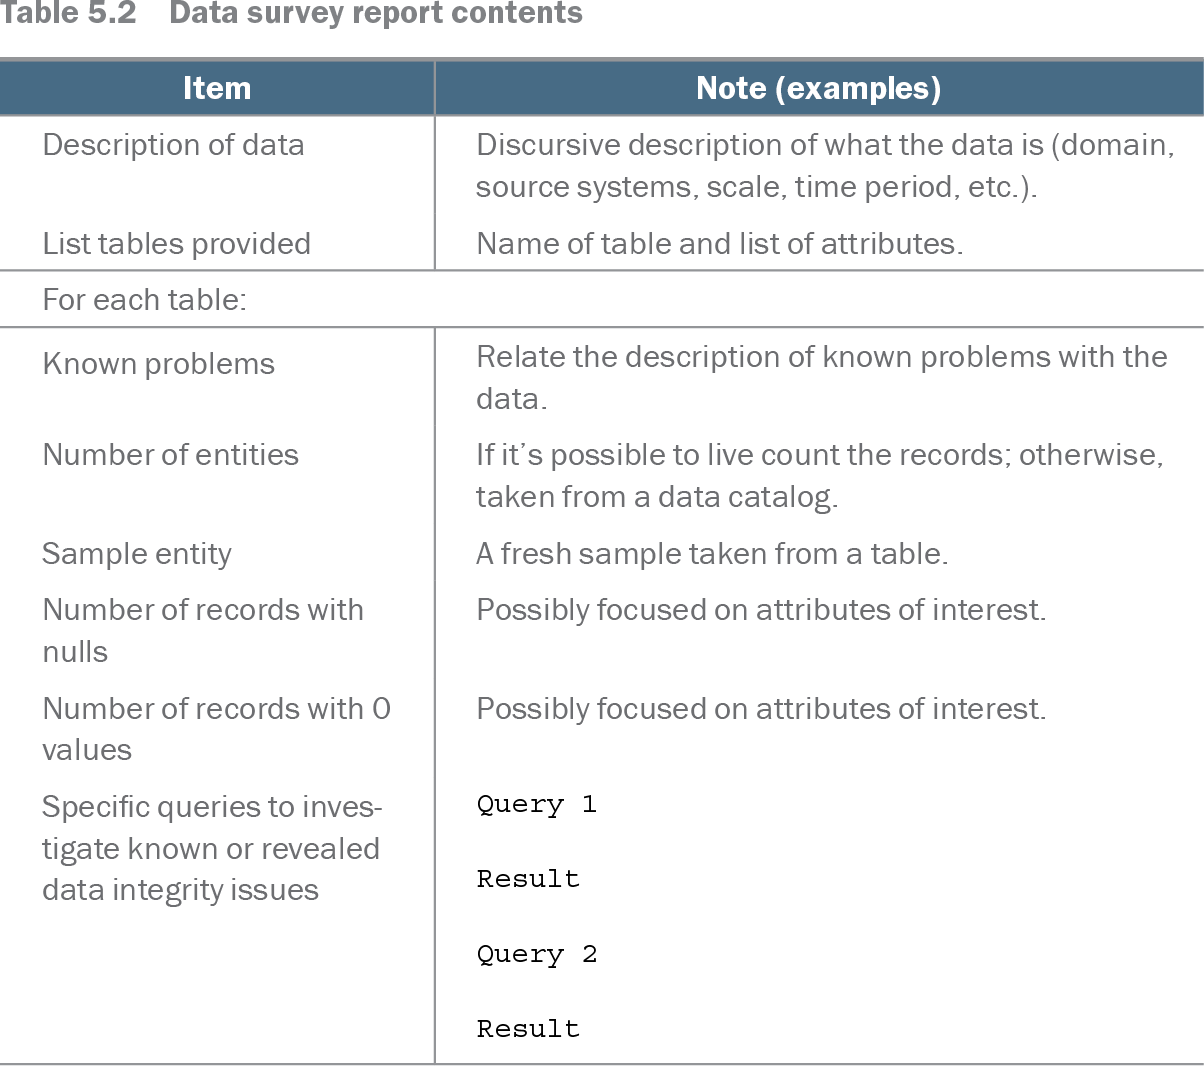
Table 5.2 Data survey report contents (view table figure)
| Item |
Note (examples) |
|---|---|
| Description of data |
Discursive description of what the data is (domain, source systems, scale, time period, etc.). |
| List tables provided |
Name of table and list of attributes. |
| For each table: |
|
| Known problems |
Relate the description of known problems with the data. |
| Number of entities |
If it’s possible to live count the records; otherwise, taken from a data catalog. |
| Sample entity |
A fresh sample taken from a table. |
| Number of records with nulls |
Possibly focused on attributes of interest. |
| Number of records with 0 values |
Possibly focused on attributes of interest. |
| Specific queries to investigate known or revealed data integrity issues |
Query 1 Result Query 2 Result |
Use the report outline as a checklist for recording resources, samples, counts, known problems, and the queries and results behind each finding. section 5.2.5
Keep a cover sheet of the important differences from expectations so a long report remains usable. The survey gives the team a shared map for EDA, infrastructure needs, and initial data tests for pipelines. For example, unexpected duplicates, aggregate-table count mismatches, or records concentrated late in each month call for investigation—even when the overall time span and record totals look plausible. section 5.2.5 section 6.6.1