liveBook · Manning

Time-series database

As explained in Machine Learning Platform Engineering

A time-series database stores measurements indexed by time so that temporal queries and retrieval are efficient.

A time-series database stores application metrics indexed by time, making temporal retrieval efficient for monitoring, dashboards, and alerts. section 3.5

In a Prometheus-based monitoring pipeline, the database:

  • Receives metrics scraped by a worker from an application endpoint such as /metrics. section 3.5
  • Supplies queried measurements to Grafana for charts and dashboards. section 3.5
  • Supports alert evaluation for conditions such as downtime, high response latency, or falling request counts. section 3.5

Prometheus and Grafana

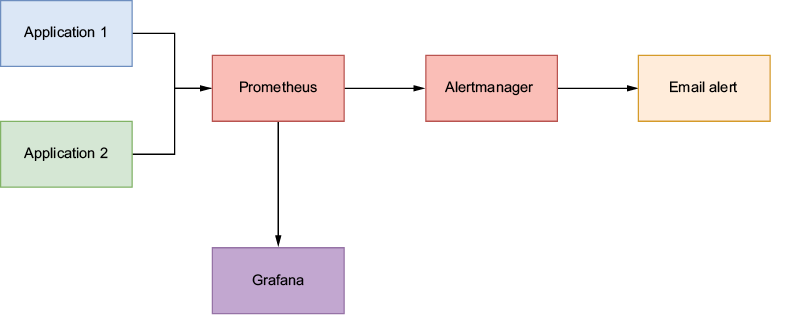
A FastAPI service exposes /metrics. Prometheus scrapes and stores its measurements, a query aggregates request increases over ten minutes by response code, and Grafana renders the result as a time-series chart. section 3.5

Figure 3.17 Application 1 and Application 2 expose an endpoint for metrics. Prometheus scrapes those metrics, which are then visualized by Grafana. Alertmanager uses those metrics to check if any alerts need to be routed to a channel; in this case, it’s an email.
A diagram of a diagram

AI-generated content may be incorrect.

Trace the production flow from application metrics endpoints through Prometheus storage to Grafana visualization and Alertmanager routing. section 3.5


How Machine Learning Platform Engineering covers it

How deep it goes
Defines time indexing and traces scraping, querying, visualization, and alerting, but does not detail storage internals.
Examples
Uses FastAPI /metrics output, request counters, Prometheus queries, Grafana charts, and response-code aggregation.
What it assumes
Assumes an application can expose metrics through an endpoint and introduces the scrape-to-dashboard workflow.
What you can do after
Operate Prometheus and Grafana to collect, query, visualize, and alert on application metrics.
How it connects
Connects application metrics with Prometheus, Grafana, Alertmanager, dashboards, scraping, and temporal queries.

Also explained in

Compare how 3 books explain time-series database →

Related concepts

This explainer was generated by Manning's knowledge graph from the text of Machine Learning Platform Engineering. The section links point to the parts of the book it draws on.
