A model may finish training without being ready to use. A learning curve makes its progress visible by plotting a performance metric against training iterations, model complexity, or training-set size. Compare training and validation performance to ask two questions before deeper error analysis: does the model converge, and does it underfit or overfit? section 9.1 section 9.5
Choose the horizontal axis to match the decision you need to make:
- Iterations or epochs: plot loss or another metric throughout one training run. A downward loss curve indicates improvement; tracking it early can reveal that continuing a long run is pointless. Keep curves from experiments for later comparison. section 9.1.2
- Model complexity: vary one complexity-related hyperparameter, train each candidate to convergence, and plot its final performance. This helps locate a useful range of tree depths, feature counts, regularization strengths, or neural-network sizes. section 9.1.4
- Training-set size: hold the validation set fixed, train on increasingly large subsets, and plot both training and validation performance. The trend helps estimate whether collecting more data is worth the effort. section 9.1.5
Read the shape before changing the system. Oscillating loss calls for checks such as label alignment, a lower learning rate, or a small-batch overfit test. Exploding loss or NaNs suggest computational, implementation, or data-preprocessing problems. If loss improves while the chosen metric stays flat, inspect the metric and its implementation. Falling training loss without comparable validation improvement can signal overfitting, but complexity is not the only possible cause: data leakage, outliers, or a training–validation distribution mismatch may also matter. section 9.1.3 section 9.1.1
Figure 9.6 Loss is decreasing for training but not validation, reflecting potential overfit.
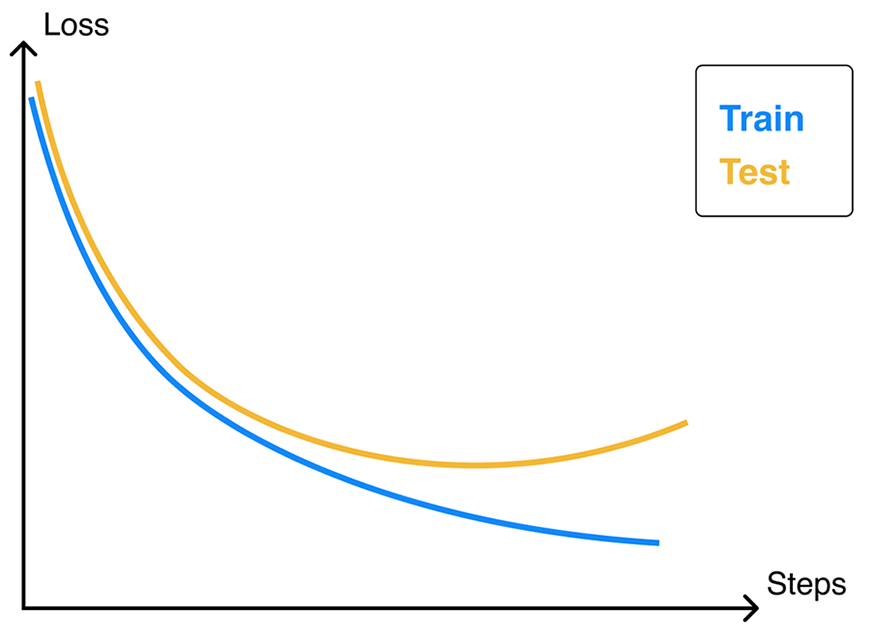
Compare the training and validation traces: training loss falls while validation loss does not, a visual warning of potential overfitting. section 9.1.3
For sample-size curves, a small gap at high loss points toward underfitting; more samples alone are unlikely to help. A large gap may indicate high variance or mismatched training and validation sets, so inspect the split before committing to data collection. Curves are evidence for a next experiment, not a diagnosis by themselves. section 9.1.5 section 9.1.1
Planning curves for image search
For a text-to-image search model with a composite loss, track each loss component alongside metric curves. Enable training on data subsets to estimate the benefit of more data, and inspect curves by dataset shard when needed. These views support early sanity checks and later tuning of learning rate, early stopping, and loss weights. section 9.4.2

