liveBook · Manning

Translation

As explained in Everyday Data Visualization

Symmetry in which repeated elements are shifted by regular intervals while retaining the same orientation.

Translation is a symmetry pattern created by stamping one element across a page at regular intervals while keeping its orientation unchanged. Repetition helps viewers spot relationships and patterns. section 2.2.4 section 2.3

Use translation when:

  • Small-multiples graphs repeat a simple chart for many categories, such as countries or companies. section 2.2.4
  • Relative differences matter more than precise values, because repeated charts make patterns visible but can hide detail. section 2.2.4
  • Typography repeats consistent styles, sizes, and placements to establish a hierarchy of importance. section 5.4.5

A practical visual example

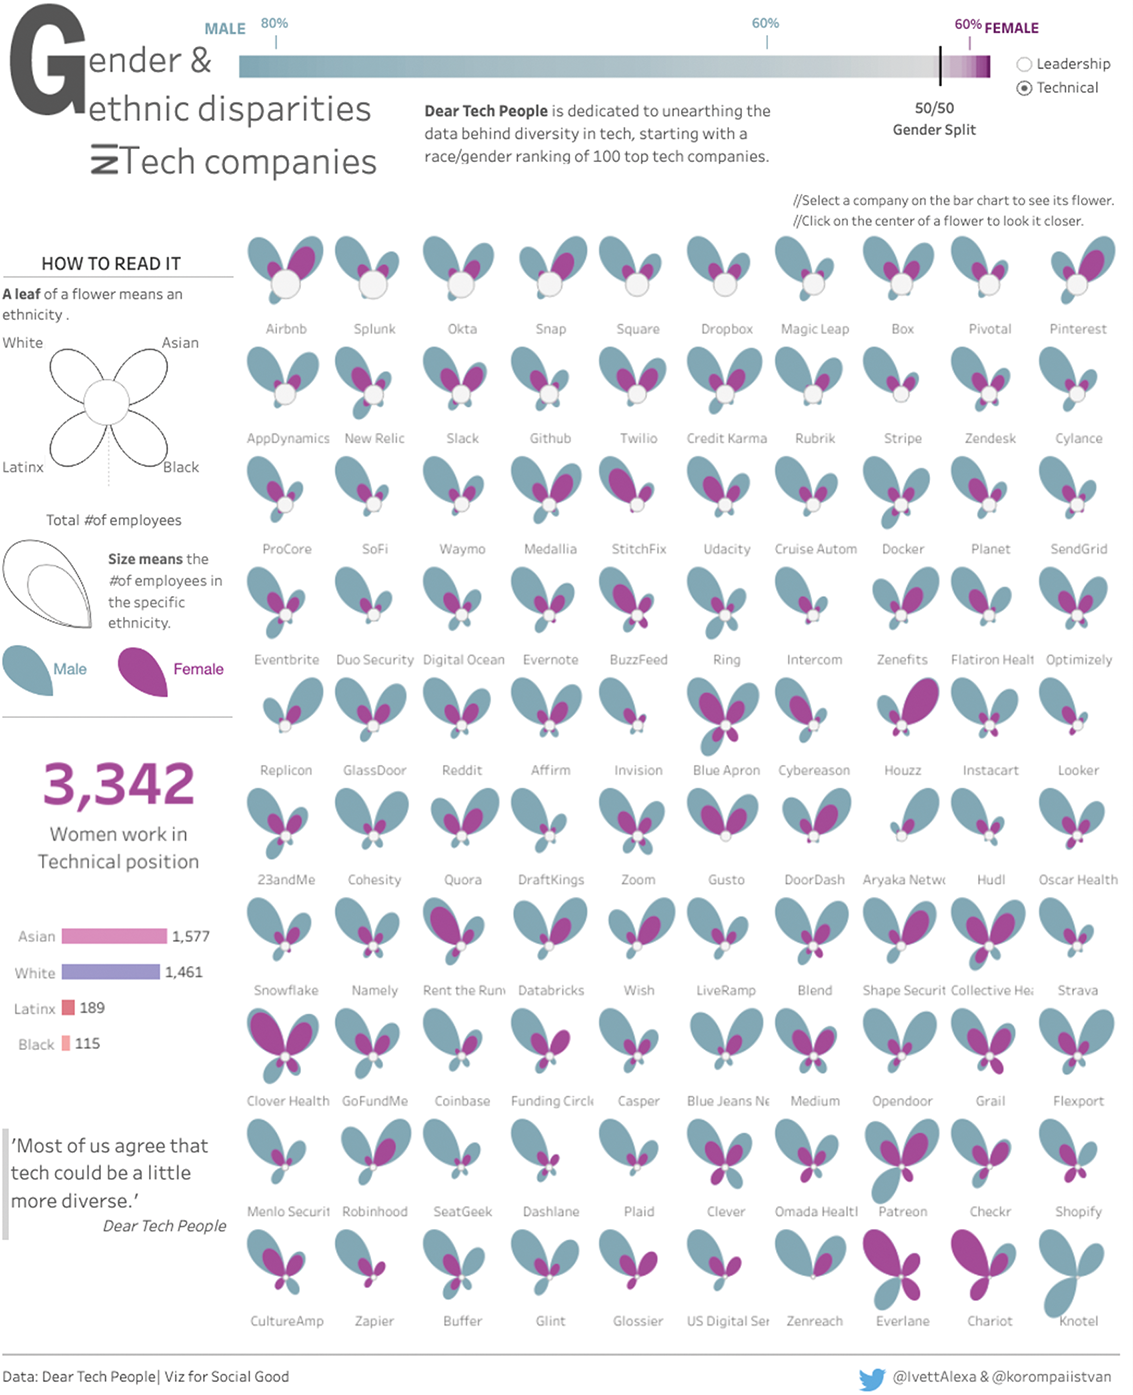
A gender- and ethnicity-disparities visualization uses repeated chart structures and recurring label styles. Matching labels signal matching importance, while the repeated charts invite comparisons across categories. section 2.2.4 section 5.4.5

Figure 2.12 Principle of symmetry: translation. (Ivett Kovacs. Used with permission. See the interactive version at http://mng.bz/G9rV.)
02-12

Inspect the translation example to see how repeated visual elements preserve orientation while supporting comparison. section 2.2.4


How Everyday Data Visualization covers it

How deep it goes
Defines the symmetry, explains its perceptual rationale, and gives visualization and typography applications, but stops short of mathematical formalism.
Examples
Uses small-multiples graphs, a gender-disparities visualization, and consistently styled pay-gap chart labels.
What it assumes
Assumes basic familiarity with data visualization and typography while defining symmetry and its visual role conversationally.
What you can do after
Apply it to repeat chart structures and typography so users can compare instances and recognize relative importance.
How it connects
Connects translational symmetry with reflection, rotation, small multiples, typography, gestalt principles, and preattentive attributes.

Also explained in

Compare how 3 books explain translation →

Related concepts

This explainer was generated by Manning's knowledge graph from the text of Everyday Data Visualization. The section links point to the parts of the book it draws on.