Visible light is electromagnetic radiation that travels as waves, with energy proportional to wavelength. Human eyes detect only a limited wavelength range, called the visible spectrum. section 4.1.1
Different wavelengths stimulate cone cells by different amounts, producing color perception. The familiar spectrum runs from red through orange, yellow, green, blue, indigo, and violet. section 4.1.1
Visible light explains several everyday color effects:
- Adding colored light produces more light; combining the spectrum produces white, which is why light uses an additive color model. section 4.1.1
- A prism or raindrop bends different wavelengths by different amounts, separating white sunlight into a rainbow. section 4.1.1
- Color theory applies this optics-based understanding to choosing colors that work together and communicate an intended message. section 4.1
A rainbow in a raindrop
Sunlight appears white because it contains many wavelengths. When a raindrop acts like a prism, those wavelengths exit at different angles and spread into the colors of a rainbow. section 4.1.1
Figure 4.1 A ray of white sunlight enters a prism and exits as a rainbow because the prism causes the different wavelengths in the white light to separate. (Prism-rainbow.svg: Suidrootderivative work. Sceptre, CC BY-SA 3.0, via Wikimedia Commons. Labels added by me)
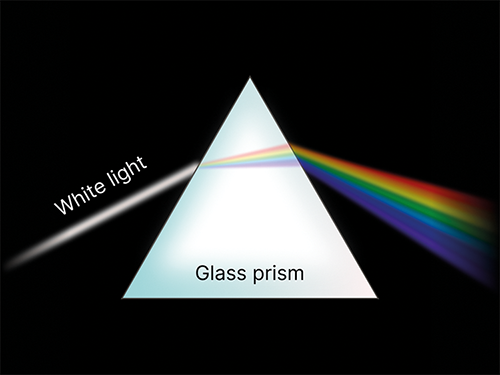
Use the prism diagram to see white sunlight enter a droplet or prism and emerge as separated wavelengths. section 4.1.1
