A whisker is a line extending from a box-plot quartile toward a distribution extreme. The lower whisker connects the minimum to the first quartile; the upper connects the third quartile to the maximum. Outliers may appear as dots beyond the whiskers. section 6.4
Build whiskers in an SVG box plot by:
- Creating a vertical line at the category’s x-scale position, from the relevant extreme to the adjacent quartile. section 6.4.4
- Adding a horizontal cap at the minimum or maximum, using the box width to determine its endpoints. section 6.4.4
- Mapping extremes and quartiles through the y-scale, accounting for SVG’s top-to-bottom coordinate direction. section 6.4 section 6.4.4
Salary-distribution box plots
A comparison of salaries for women and men uses separate box plots. Each plot combines a rectangle, median line, and whiskers, while individual salary points can be added as circles. section 6.4.4
Figure 6.14 A box plot is composed of a rectangle extending from the first to the third quartile, a line positioned at the median, and whiskers extending from the minimum value to the first quartile and from the third quartile to the maximum value.
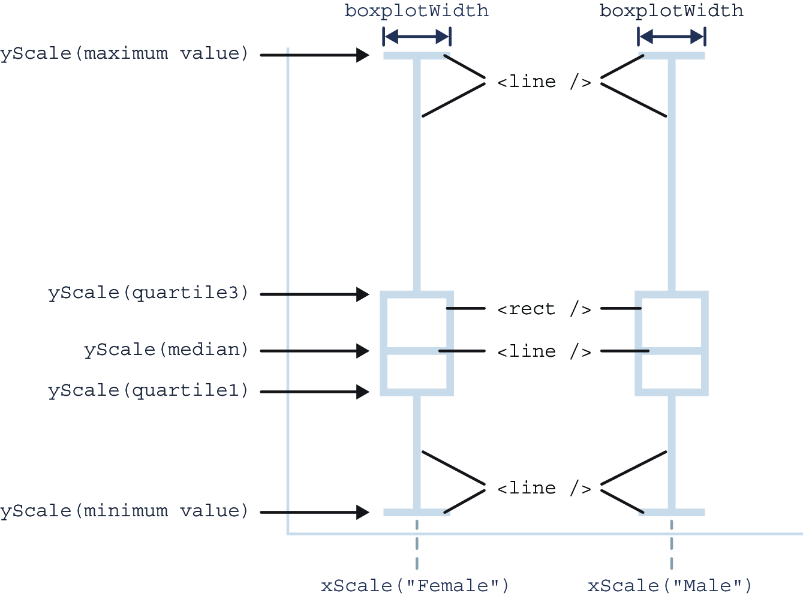
Shows how the rectangle, median, and two whiskers combine into one box plot. section 6.4.4

