Win shares rolls a player’s offensive and defensive statistics into one measure of overall contribution to team wins. Career win shares accumulates that contribution across a career, making it a productivity measure for comparing NBA draft outcomes. section 3.5.3 section 2.0
Career totals vary sharply: in the 2000–2009 first-round draft sample, most players recorded fewer than 25 career win shares, while a small number of stars lifted the mean well above the median. Basic summaries therefore use minimum, maximum, quartiles, median, and mean rather than relying on one average alone. section 2.5.1 section 2.7
Use win shares to investigate concrete basketball questions:
- Compare career productivity by draft-pick segment with mean and median win shares; picks 1–5 averaged nearly twice the career total of picks 6–10. section 3.5.3
- Check associations with games played, minutes per game, win shares per 48 minutes, and draft age. These correlations describe association, not causation. section 2.5.4
- Set an optimization objective using projected seasonal win shares when selecting free agents under roster constraints. section 4.6
Reading career totals
A career total of 25 or fewer win shares characterizes second-string or marginal players in this framing. Totals of 50 or more generally align with many years as a full-time starter, 75–100 with frequent All-Star selections, and more than 100 with Hall of Fame-level careers. section 3.5.3
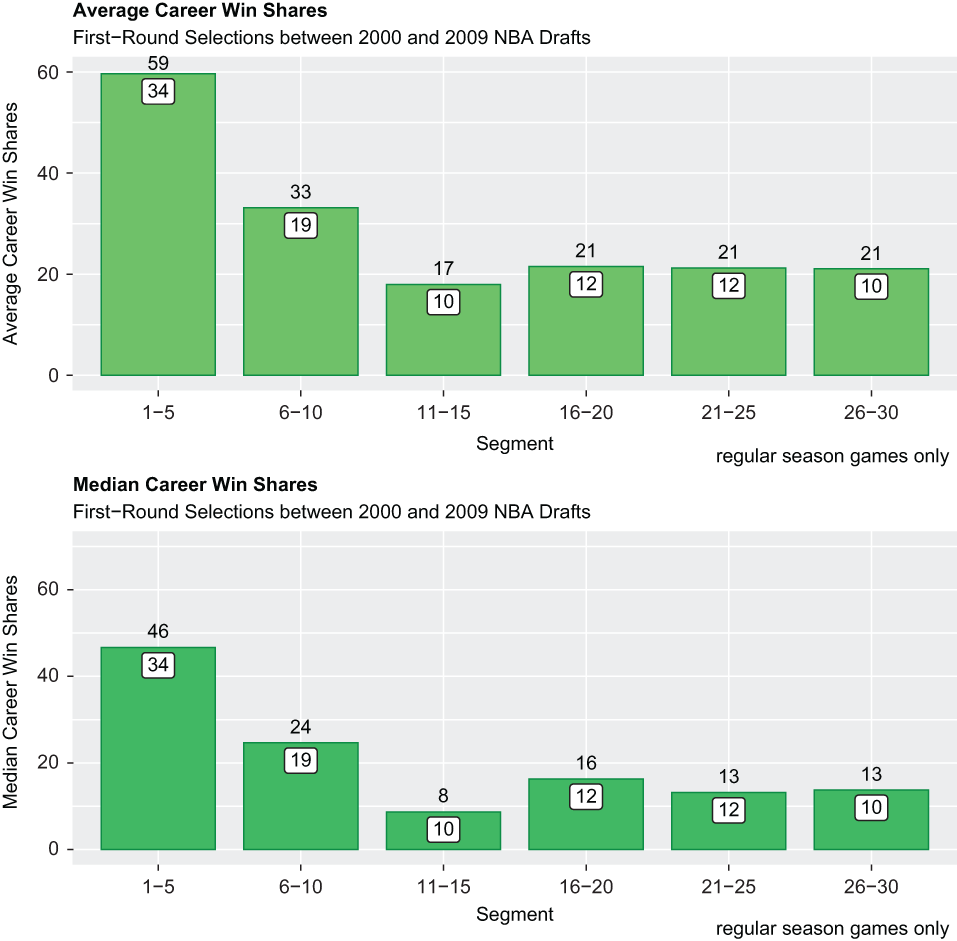
Compare mean and median career win shares across six first-round pick segments; the paired charts make the separation at the top of the draft visible. section 3.5.3
