Chapter 4. Event stream processing with Amazon Kinesis
This chapter covers
- Amazon Kinesis, a fully managed unified log service
- Systems monitoring as a unified log use case
- Using the AWS CLI tools to work with Kinesis
- Building simple Kinesis producers and consumers in Python
So far in this book, we have worked exclusively with Apache Kafka as our unified log. Because it is an open source technology, we have had to set up and configure Kafka and its dependencies (such as ZooKeeper) ourselves. This has given us great insight into how a unified log works “under the hood,” but some of you may be wondering whether there is an alternative that is not so operationally demanding. Can we outsource the operation of our unified log to a third party, without losing the great qualities of the unified log?
The answer is a qualified yes. This chapter introduces Amazon Kinesis (https://aws.amazon.com/kinesis/), a hosted unified log service available as part of Amazon Web Services. Developed internally at Amazon to solve its own challenges around log collection at scale, Kinesis has extremely similar semantics to Kafka—along with subtle differences that we will tease out in this chapter.
Before kicking off this chapter, you might want to jump to the appendix for a brief AWS primer that will get you up to speed on the Amazon Web Services platform, unless you already know your way into the AWS ecosystem. Once your AWS account is set up, this chapter will show you how to use the AWS command-line interface (CLI) tools to create your first event stream in Kinesis and write and read some events to it.
We will then dive into a new use case for the unified log: using it for systems monitoring. We will create a simple long-running agent in Python that emits a steady stream of readings from our server, writing these events to Kinesis by using the AWS Python SDK. Once we have these events in Kinesis, we will write another Python application that monitors our agent’s events, looking for potential problems. Again, this Python monitoring application will be built using the AWS Python SDK, also known as boto.
Please note that, as Amazon Kinesis Data Streams is not currently available in AWS Free Tier, the procedures in this book will necessarily involve creating live resources in your Amazon Web Services account, which can incur some charges.[1] Don’t worry—I will tell you as soon as you can safely delete a given resource. In addition, you can set alerts on your spending in order to be notified whenever the charges go above a certain threshold.[2]
1You can find more information about the pricing of AWS Kinesis Data Streams at https://aws.amazon.com/kinesis/streams/pricing/.
2You can set up AWS billing notification alerts at https://docs.aws.amazon.com/awsaccountbilling/latest/aboutv2/billing-getting-started.html#d0e1069.
Our AWS account is set up, and we have the AWS CLI primed for action: we’re ready to introduce the project we’ll be working through! In previous chapters, we focused on events related to end-user behavior. In this chapter, we’ll take a different tack and generate a simple stream of events related to systems monitoring.
Let’s imagine that our company has a server that keeps running out of space. It hosts a particularly chatty application that keeps generating lots of log files. Our systems administrator wants to receive a warning whenever the server’s disk reaches 80% full, so that he can go in and manually archive and remove the excess log files.
Of course, there is a rich, mature ecosystem of systems monitoring tools that could meet this requirement. Simplifying somewhat,[3] these tools typically use one of two monitoring architectures:
3A good article about push versus pull monitoring is at https://web.archive.org/web/20161004192212/ https://www.boxever.com/push-vs-pull-for-monitoring.
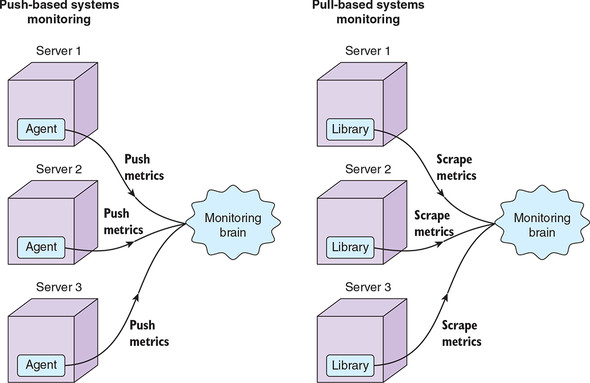
- Push-based monitoring— An agent running on each monitored system periodically sends data (often called metrics) into a centralized system. Push-based monitoring systems include Ganglia, Graphite, collectd, and StatsD.
- Pull-based monitoring— The centralized system periodically “scrapes” metrics from each monitored system. Pull-based monitoring systems include JMX, librit, and WMI.
Figure 4.1 depicts both the push and pull approaches. Sometimes a systems monitoring tool will provide both approaches. For example, Zabbix and Prometheus are predominantly pull-based systems with some push support.
Figure 4.1. In push-based systems monitoring, an agent pushes metrics at regular intervals into a centralized system. By contrast, in pull-based architectures, the centralized system regularly scrapes metrics from endpoints available on the servers.
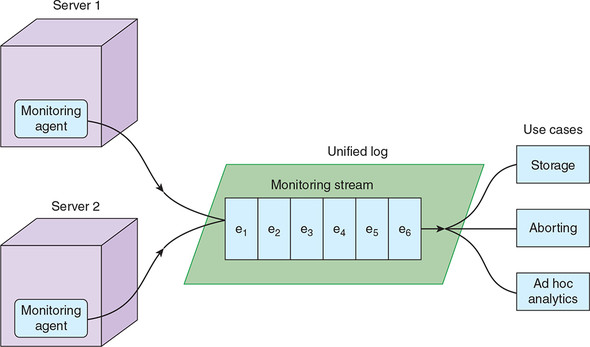
In the push-based model, we have agents generating events and submitting them to a centralized system; the centralized system then analyzes the event stream obtained from all agents. Does this sound familiar? We can transplant this approach directly into our unified log, as per figure 4.2. The building blocks are the same, as you saw in earlier chapters: event producers, a unified log, and a set of event consumers. But there are two main differences from our previous unified log experiences:
- Instead of adding event tracking to an existing application like HelloCalculator, we will be creating a dedicated agent that exists only to send events to our unified log.
- Rather than the subject of our events being an end user, the subject will now be our agent, because it is this agent that is actively taking readings from the server.
Figure 4.2. We can implement push-based systems monitoring on top of our unified log. The agents running on our servers will emit events that are written to our unified log, ready for further processing.
It looks, then, like it should be straightforward to meet our systems administrator’s monitoring requirements by using a unified log such as Apache Kafka or Amazon Kinesis. We will be using Kinesis for this chapter, so before we get started, we’ll take a brief look at the terminology differences between Kafka and Kinesis.
Amazon Kinesis has extremely similar semantics to Apache Kafka. But the two platforms diverge a little in the descriptive language that they use. Figure 4.3 sets out the key differences: essentially, Kinesis uses streams, whereas Kafka uses topics. Kinesis streams consist of one or more shards, whereas Kafka topics contain partitions. Personally, I prefer the Kinesis terms to Kafka’s: they are a little less ambiguous and have less “message queue” baggage.
Figure 4.3. The equivalent of a Kafka topic in Kinesis is a stream. A stream consists of one or more shards, whereas Kafka refers to partitions.

Differences of language aside, the fact that Kinesis offers the same key building blocks as Kafka is encouraging: it suggests that almost everything we could do in Kafka, we can do in Kinesis. To be sure, we will come across differences of approach and capability through this chapter; I will make sure to highlight these as they come up. For now, let’s get started with Kinesis.
First, we need a Kinesis stream to send our systems monitoring events to. Most commands in the AWS CLI follow this format:
$ aws [service] [command] options...
In our case, all of our commands will start with aws kinesis. You can find a full reference of all available AWS CLI commands for Kinesis here:
https://docs.aws.amazon.com/cli/latest/reference/kinesis/index.html
We can create our new stream by using the AWS CLI like so:
$ aws kinesis create-stream --stream-name events \
  --shard-count 2 --profile ulp
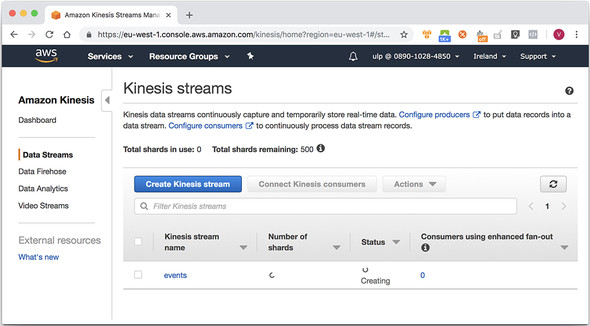
Press Enter, and then switch back to the AWS web interface, and click Amazon Kinesis. If you are quick enough, you should see the new stream listed with its status set to CREATING, and with a count of 0 shards, as in figure 4.4. After the stream is created, Kinesis will report the stream status as ACTIVE and display the correct number of shards. We can write events to and read events from only ACTIVE streams.
Figure 4.4. Our first Amazon Kinesis stream is being created. After a few more seconds, we will see a status of ACTIVE and the correct shard count.
We created our stream with two shards; events that are sent to the event stream will be written to one or either of the two shards. Any stream processing apps that we write will have to make sure to read events from all shards. At the time of writing, Amazon enforces a few limits around shards:[4]
4AWS Kinesis Data Streams limits are described at https://docs.aws.amazon.com/streams/latest/dev/service-sizes-and-limits.html.
- You are allowed 200 shards per AWS region by default, except for the following AWS regions, which allow up to 500 shards: US East (N. Virginia), US West (Oregon), and EU (Ireland).
- Each shard supports up to five read transactions per second. Each transaction can provide up to 10,000 records, with an upper limit of 10 MB per transaction.
- Each shard supports writing up to 1 MB of record data per second, and up to 1,000 records per second.
Don’t worry—we won’t be hitting any of these limits; we could have happily made do with just one shard in our stream.
So, at this point, we have our Kinesis stream ready and waiting to receive events. In the next section, let’s model those events.
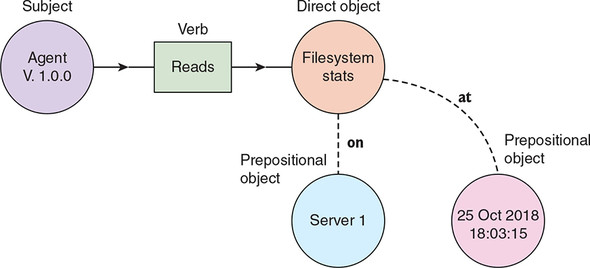
Remember that our systems administrator wants to receive a warning whenever the troublesome server’s disk reaches 80% full. To support this monitoring, the agent running on the server will need to regularly read filesystem metrics and send those metrics into our unified log for further analysis. We can model these metrics readings as events by using the grammatical structure introduced in chapter 2:
- Our agent is the subject of the event.
- Read (“took a reading”) is the verb of the event.
- Filesystem metrics are the direct object of the event.
- The reading takes place on our server, a prepositional object.
- The reading takes place at a specific time, another prepositional object.
Putting these together, we can sketch out the event model that we’ll need to assemble, as in figure 4.5.
Figure 4.5. Our systems monitoring events involve an agent reading filesystem metrics on a given server at a specific point in time.
Now that you know what our events should look like, let’s write our agent.
We are going to write our agent in Python, making use of the excellent boto3 library, which is the official Python SDK for AWS.[5] All the official language-specific SDKs for AWS support writing events to Kinesis, which seems fair: for Kinesis to be a truly unified log, we need to be able to send events to it from all our various client applications, whatever language they are written in.
5You can download the Python SDK for AWS from https://aws.amazon.com/sdk-for-python/.
Let’s get started. We are going to build up our systems monitoring agent piece by piece, using the Python interactive interpreter. Start it up by logging into your Vagrant guest and typing python at the command prompt:
Python 2.7.12 (default, Dec  4 2017, 14:50:18)
[GCC 5.4.0 20160609] on linux2
Type "help", "copyright", "credits" or "license" for more information.
>>>
First let’s define and test a function that gives us the filesystem metrics that we need. Paste the following into your Python interpreter, being careful to keep the white-space intact:
import os
def get_filesystem_metrics(path):
  stats = os.statvfs(path)
  block_size = stats.f_frsize
  return (block_size * stats.f_blocks, # Filesystem size in bytes
    block_size * stats.f_bfree,        # Free bytes
    block_size * stats.f_bavail)       # Free bytes excl. reserved space

s, f, a = get_filesystem_metrics("/")
print "size: {}, free: {}, available: {}".format(s, f, a)
size: 499046809600, free: 104127823872, available: 103865679872
Good—now you know how to retrieve the information we need about the filesystem. Next, let’s create all the metadata that we need for our event. Paste in the following:
import datetime, socket, uuid
def get_agent_version():
  return "0.1.0"

def get_hostname():
  return socket.gethostname()

def get_event_time():
  return datetime.datetime.now().isoformat()

def get_event_id():
  return str(uuid.uuid4())

print "agent: {}, hostname: {}, time: {}, id: {}".format(
  get_agent_version(), get_hostname(), get_event_time(), get_event_id())
You should now see something a little like this:
agent: 0.1.0, hostname: Alexanders-MacBook-Pro.local, time:
2018-11-01T09:00:34.515459, id: 42432ebe-40a5-4407-a066-a1361fc31319
Note that we are uniquely identifying each event by attaching a freshly minted version 4 UUID as its event ID.[6] We will explore event IDs in much more detail in chapter 10.
6Wikipedia provides a good description of universally unique identifiers: https://en.wikipedia.org/wiki/Universally_unique_identifier.
Let’s put this all together with a function that creates our event as a Python dictionary. Type in the following at the interpreter:
def create_event():
  size, free, avail = get_filesystem_metrics("/")
  event_id = get_event_id()
  return (event_id, {
    "id": event_id,
    "subject": {
      "agent": {
        "version": get_agent_version()
      }
    },
    "verb": "read",
    "direct_object": {
      "filesystem_metrics": {
        "size": size,
        "free": free,
        "available": avail
      }
    },
    "at": get_event_time(),
    "on": {
      "server": {
        "hostname": get_hostname()
      }
    }
  })

print create_event()
It’s a little verbose, but the intent should be clear from the Python interpreter’s output, which should be something like this:
('60f4ead5-8a1f-41f5-8e6a-805bbdd1d3f2', {'on': {'server': {'hostname':
 'ulp'}}, 'direct_object': {'filesystem_metrics': {'available':
 37267378176, 'free': 39044952064, 'size': 42241163264}}, 'verb':
 'read', 'at': '2018-11-01T09:02:31.675773', 'id':
 '60f4ead5-8a1f-41f5-8e6a-805bbdd1d3f2', 'subject': {'agent':
 {'version': '0.1.0'}}})
We have now constructed our first well-structured systems monitoring event! How do we send it to our Kinesis stream? It should be as simple as this:
def write_event(conn, stream_name):
  event_id, event_payload = create_event()
  event_json = json.dumps(event_payload)
  conn.put_record(StreamName=stream_name, Data=event_json,
PartitionKey=event_id)
The key method to understand here is conn.put_record, which takes three required arguments:
- The name of the stream to write to
- The data (sometimes called body or payload) of the event. We are sending this data as a Python string containing our JSON.
- The partition key for the event. This determines which shard the event is written to.
Now we just need to connect to Kinesis and try writing an event. This is as simple as the following:
import boto3

session = boto3.Session(profile_name="ulp")
Conn = session.client("kinesis", region_name="eu-west-1")

write_event(conn, "events")
Part of the reason that this code is so simple is that the AWS CLI tool that you configured earlier uses boto, the AWS SDK for Python, under the hood. Therefore, boto can access the AWS credentials that you set up earlier in the AWS CLI without any trouble.
Press Enter on the preceding code and you should be greeted with ... silence! Although, in this case, no news is good news, it would still be nice to get some visual feedback. This can be arranged: next, put the sending of our event into an infinite loop in the Python interpreter, like so:
while True:
  write_event(conn, "events")
Leave this running for a couple of minutes, and then head back into the Kinesis section of the AWS web interface, and click your events stream to bring up the Stream Details view. At the bottom of this view, in the Monitoring tab, you should be able to see the beginnings of lines on some of the charts, as in figure 4.6.
Figure 4.6. The Monitoring tab in the Stream Details view lets you review the current and historical performance of a given Kinesis stream.
;%22/%3E%3C/svg%3E)
Unfortunately, this is the only visual confirmation we can get that we are successfully writing to our Kinesis stream—at least until we write some kind of stream consumer. We will do that soon, but first let’s wrap up our systems monitoring agent. We won’t need the Python interpreter anymore, so you can kill the infinite loop with Ctrl-C, and then exit the interpreter with Ctrl-D.
Let’s consolidate all of our work at the interpreter into a single file to run our agent’s core monitoring loop. Create a file called agent.py and populate it with the contents of the following listing.
Listing 4.1. agent.py
#!/usr/bin/env python

import os, datetime, socket, json, uuid, time, boto3

def get_filesystem_metrics(path):
  stats = os.statvfs(path)
  block_size = stats.f_frsize
  return (block_size * stats.f_blocks, # Filesystem size in bytes
    block_size * stats.f_bfree,        # Free bytes
    block_size * stats.f_bavail)       # Free bytes excluding reserved space

def get_agent_version():
  return "0.1.0"

def get_hostname():
  return socket.gethostname()

def get_event_time():
  return datetime.datetime.now().isoformat()

def get_event_id():
  return str(uuid.uuid4())

def create_event():
  size, free, avail = get_filesystem_metrics("/")
  event_id = get_event_id()
  return (event_id, {
    "id": event_id,
    "subject": {
      "agent": {
        "version": get_agent_version()
      }
    },
    "verb": "read",
    "direct_object": {
      "filesystem_metrics": {
        "size": size,
        "free": free,
        "available": avail
      }
    },
    "at": get_event_time(),
    "on": {
      "server": {
        "hostname": get_hostname()
      }
    }
  })

def write_event(conn, stream_name):
  event_id, event_payload = create_event()
  event_json = json.dumps(event_payload)
  conn.put_record(StreamName=stream_name, Data=event_json,
PartitionKey=event_id)
  return event_id

if __name__ == '__main__':                                   #1
  session = boto3.Session(profile_name="ulp")
  conn = session.client("kinesis", region_name="eu-west-1")
  while True:                                                #2
    event_id = write_event(conn, "events")
    print (f'Wrote event: {event_id}')
    time.sleep(10)                                           #3
Make the agent.py file executable and run it:
chmod +x agent.py
./agent.py
Wrote event 481d142d-60f1-4d68-9bd6-d69eec5ff6c0
Wrote event 3486558d-163d-4e42-8d6f-c0fb91a9e7ec
Wrote event c3cd28b8-9ddc-4505-a1ce-193514c28b57
Wrote event f055a8bb-290c-4258-90f0-9ad3a817b26b
...
Our agent is running! Check out figure 4.7 for a visualization of what we have created.
Figure 4.7. Our systems monitoring agent is now emitting an event containing filesystem statistics every 10 seconds.
;%22/%3E%3C/svg%3E)
Leave our Python agent running in a terminal. It will continue to write an Agent read filesystem metrics event every 10 seconds. Now we need to write our stream processing app to consume this stream of events and notify us if our server’s disk reaches the dreaded 80% full.
A variety of frameworks and SDKs can read events from a Kinesis stream. Let’s review these briefly, and then use two of these tools to implement basic monitoring of our event stream.
For such a young platform, Kinesis already supports a slightly bewildering array of frameworks and SDKs for event stream processing. Here are the main ones:
- The AWS CLI introduced earlier has a small set of commands to help with reading records from a given shard within a Kinesis stream.[7]
7See the AWS CLI Command Reference for a list of these commands: https://docs.aws.amazon.com/cli/latest/reference/kinesis/index.html#cli-aws-kinesis.
- Each official AWS SDK has support for reading records from a Kinesis stream. Your calling application is expected to run a thread for each shard within the stream, and you are responsible for keeping track of your current processing position within each shard.
- A higher-level framework, again written by the AWS team, is called the Kinesis Client Library (KCL) for Java.[8] This uses the Amazon DynamoDB database to keep track of your calling application’s processing positions within each shard. It also handles the “division of labor” between multiple instances of a KCL-powered application running on separate servers, which is useful for horizontal scaling.
8You can download the official Kinesis Client library for Java from GitHub at https://github.com/awslabs/amazon-kinesis-client.
- The KCL for Java includes a MultiLangDaemon, which enables Kinesis Client Library applications to be written in other languages. At the time of writing, there is only a Kinesis Client Library for Python built using this.[9]
9You can download the official Kinesis Client library for Python from https://github.com/awslabs/amazon-kinesis-client-python.
- AWS Lambda is a fully managed stream processing platform running on a Node.js cluster. You write and upload JavaScript functions and assign them to be run for every event in an AWS-native event stream such as Kinesis. Functions must be short-lived (completing in no more than 15 minutes) and cannot use local state. It is also possible to write functions in Java, Python, Go, Ruby, and C#.
- Apache Storm has a Kinesis Storm Spout, created by the AWS team, which retrieves data records from Amazon Kinesis and emits them as tuples, ready for processing in Storm.
- Apache Spark Streaming, which is Spark’s microbatch processing framework, can convert a Kinesis stream into an InputDStream ready for further processing. This functionality is built on top of the KCL for Java.
A surprising omission from the preceding list is Apache Samza—surprising because, as you have seen, the semantics of Amazon Kinesis and Apache Kafka are extremely similar. Given how well Samza works with Kafka (see chapter 5), we might expect it to work well with Kinesis too.
Let’s start with the “rawest” tool for processing a Kinesis stream: the AWS CLI. You would likely choose a higher-level framework to build a production application, but the AWS CLI will give you familiarity with the key building blocks underpinning those frameworks.
First, we’ll use the describe-stream command to review the exact contents of our Kinesis stream:
$ aws kinesis describe-stream --stream-name events --profile ulp
{
    "StreamDescription": {
        "Shards": [
            {
                "ShardId": "shardId-000000000000",
                "HashKeyRange": {
                    "StartingHashKey": "0",
                    "EndingHashKey": "170141183460469231731687303715884105727"
                },
                "SequenceNumberRange": {
                    "StartingSequenceNumber":
     "49589726466290061031074327390112813890652759903239667714"
                }
            },
            {
                "ShardId": "shardId-000000000001",
                "HashKeyRange": {
                    "StartingHashKey": "170141183460469231731687303715884105728",
                    "EndingHashKey": "340282366920938463463374607431768211455"
                },
                "SequenceNumberRange": {
                    "StartingSequenceNumber":
     "49589726466312361776272858013254349608925408264745648146"
                }
            }
        ],
        "StreamARN": "arn:aws:kinesis:eu-west-1:089010284850:stream/events",
        "StreamName": "events",
        "StreamStatus": "ACTIVE",
        "RetentionPeriodHours": 24,
        "EnhancedMonitoring": [
            {
                "ShardLevelMetrics": []
            }
        ],
        "EncryptionType": "NONE",
        "KeyId": null,
        "StreamCreationTimestamp": 1541061618.0
    }
}
The response is a JSON structure containing an array of Shards, which in turn contains definitions for our stream’s two shards. Each shard is identified by a unique ShardId, and contains metadata:
- The HashKeyRange, which determines which events will end up in which partition, depending on the hashed value of the event’s partition key. This is illustrated in figure 4.8.
- The SequenceNumberRange, which records the sequence number of the first event in the stream. You will see only an upper bound on this range if the shard has been closed and no further events will be added.
Figure 4.8. By applying an MD5 hash to our shard key (which is our event ID), we can determine which shard Kinesis will store the event in, based on the shards’ individual hash key ranges.
;%22/%3E%3C/svg%3E)
Before we can read events from our stream, we need to retrieve what Amazon calls a shard iterator for each shard in the stream. A shard iterator is a slightly abstract concept. You can think of it as something like a short-lived (five-minute) file handle on a given shard. Each shard iterator defines a cursor position for a set of sequential reads from the shard, where the cursor position takes the form of the sequence number of the first event to read. Let’s create a shard iterator now:
$ aws kinesis get-shard-iterator --stream-name=events \
  --shard-id=shardId-000000000000 --shard-iterator-type=TRIM_HORIZON \
  --profile=ulp
{
    "ShardIterator": "AAAAAAAAAAFVbPjgjXyjJOsE5r4/MmA8rntidIRFxTSs8rKLXSs8
kfyqcz2KxyHs3V9Ch4WFWVQvzj+xO1yWZ1rNWNjn7a5R3u0aGkMjl1U2pemcJHfjkDmQKcQDwB
1qbjTdN1DzRLmYuI3u1yNDIfbG+veKBRLlodMkZOqnMEOY3bJhluDaFlOKUrynTnZ3oNA2/4zE
7uE="
}
We specified that the shard iterator should be of type TRIM_HORIZON. This is AWS jargon for the oldest events in the shard that have not yet been trimmed—expired for being too old. At the time of writing, records are trimmed from a Kinesis stream after a fixed period of 24 hours. This period can be increased up to 168 hours but will incur an additional cost. There are three other shard iterator types:
- LATEST—This returns the “most recent” data from the shard.
- AT_SEQUENCE_NUMBER—This lets us read a shard starting from the event with the specified sequence number.
- AFTER_SEQUENCE_NUMBER—This lets us read a shard starting from the event immediately after the one with the specified sequence number.
Figure 4.9 illustrates the various shard iterator options.
Figure 4.9. The four configuration options for a Kinesis shard iterator allow us to start reading a shard of our event stream from various points.
;%22/%3E%3C/svg%3E)
Now we are ready to try reading some records by using our new shard iterator:
$ aws kinesis get-records --shard-iterator
     "AAAAAAAAAAFVbPjgjXyjJOsE5r4/MmA8rntidIRFxTSs8rKLXSs8kfyqcz2KxyHs3V9Ch4WFW
VQvzj+xO1yWZ1rNWNjn7a5R3u0aGkMjl1U2pemcJHfjkDmQKcQDwB1qbjTdN1DzRLmYuI3u1yN
DIfbG+veKBRLlodMkZOqnMEOY3bJhluDaFlOKUrynTnZ3oNA2/4zE7uE=" --profile=ulp
{
    "Records": [],
    "NextShardIterator": "AAAAAAAAAAHQ8eRw4sduIDKhasXSpZtpkI4/uMBsZ1+ZrgT8
/Xg0KQ5GwUqFMIf9ooaUicRpfDVfqWRMUQ4rzYAtDIHuxdJSeMcBYX0RbBeqvc2AIRJH6BOXC6
nqZm9qJBGFIYvqb7QUAWhEFz56cnO/HLWAF1x+HUd/xT21iE3dgAFszY5H5aInXJCw+vfid4Yn
O9PZpCU="
}
An empty array of records! That’s okay; this simply means that this initial portion of the shard doesn’t contain any events. The AWS documentation warns us that we might have to cycle through a few shard iterators before we reach any events. Fortunately, the NextShardIterator gives us the next “file handle” to use, so let’s plug this into our next get-records call:
$ aws kinesis get-records --shard-iterator
"AAAAAAAAAAEXsqVd9FvzqV7/M6+Dbz989dpSBkaAbn6/cESUTbKHNejQ3C3BmjKfRR57jQuQb
Vhlh+uN6xCOdJ+KIruWvqoITKQk9JsHa96VzJVGuLMY8sPy8Rh/LGfNSRmKO7CkyaMSbEqGNDi
gtjz7q0S41O4KL5BFHeOvGce6bJK7SJRA4BPXBITh2S1rGI62N4z9qnw=" --profile=ulp
{
    "Records": [
        {
            "PartitionKey": "b5ed136d-c879-4f2e-a9ce-a43313ce13c6",
            "Data": "eyJvbiI6IHsic2VydmVyIjogeyJob3N0bmFtZSI6ICJ1bHAifX0sI
CJkaXJlY3Rfb2JqZWN0IjogeyJmaWxlc3lzdGVtX21ldHJpY3MiOiB7ImF2YWlsYWJsZSI6IDM
3MjY2OTY4NTc2LCAiZnJlZSI6IDM5MDQ0NTQyNDY0LCAic2l6ZSI6IDQyMjQxMTYzMjY0fX0sI
CJ2ZXJiIjogInJlYWQiLCAiYXQiOiAiMjAxNS0wMy0xMFQyMjo1MTo1Ny4wNjY3MzUiLCAiaWQ
IOiAiYjVlZDEzNmQtYzg3OS00ZjJlLWE5Y2UtYTQzMzEzY2UxM2M2IiwgInN1YmplY3QiOiB7I
mFnZW50IjogeyJ2ZXJzaW9uIjogIjAuMS4wIn19fQ==",
            "SequenceNumber": "4954852586058767917223324843693285354050539
8606492073986"
        },
        ...
    ],
    "NextShardIterator":"AAAAAAAAAAHBdaV/lN3TN2LcaXhd9yYb45IPOc8mR/ceD5vpw
uUG0Ql5pj9UsjlXikidqP4J9HUrgGa1iPLNGm+DoTH0Y8zitlf9ryiBNueeCMmhZQ6jX22yani
YKz4nbxDTKcBXga5CYDPpmj9Xb9k9A4d53bIMmIPF8JATorzwgoEilw/rbiK1a6XRdb0vDj5VH
fwzSYQ="
}
I have elided the output, but this time the AWS CLI returns 24 records, along with a NextShardIterator for us to fetch further events from our shard. Let’s just check that the Base64-encoded contents of an event are as we expect. Again, in the Python interpreter, type in the following:
import base64
base64.b64decode("eyJvbiI6IHsic2VydmVyIjogeyJob3N0bmFtZSI6ICJ1bHAifX0sICJk
AXJlY3Rfb2JqZWN0IjogeyJmaWxlc3lzdGVtX21ldHJpY3MiOiB7ImF2YWlsYWJsZSI6IDM3Mj
Y2OTY4NTc2LCAiZnJlZSI6IDM5MDQ0NTQyNDY0LCAic2l6ZSI6IDQyMjQxMTYzMjY0fX0sICJ2
ZXJiIjogInJlYWQiLCAiYXQiOiAiMjAxNS0wMy0xMFQyMjo1MTo1Ny4wNjY3MzUiLCAiaWQiOi
AiYjVlZDEzNmQtYzg3OS00ZjJlLWE5Y2UtYTQzMzEzY2UxM2M2IiwgInN1YmplY3QiOiB7ImFn
ZW50IjogeyJ2ZXJzaW9uIjogIjAuMS4wIn19fQ==")
And you should see this:
{"on": {"server": {"hostname": "ulp"}}, "direct_object":
     {"filesystem_metrics": {"available": 37266968576, "free":
 39044542464, "size": 42241163264}}, "verb": "read", "at":
 "2018-11-01T09:02:31.675773", "id":
 "b5ed136d-c879-4f2e-a9ce-a43313ce13c6", "subject": {"agent":
 {"version": "0.1.0"}}}'
Good—we can finally confirm that our systems monitoring agent has faithfully recorded our event contents in Kinesis using boto.
Another thing to stress is that, just as in Kafka, each of these records is still stored in the Kinesis stream, available for other applications to consume. It’s not like the act of reading has “popped” these events off the shard forever. We can demonstrate this quickly by creating an all-new shard iterator, this time laser-focused on this same event:
$ aws kinesis get-shard-iterator --stream-name=events \
  --shard-id=shardId-000000000000 \
  --shard-iterator-type=AT_SEQUENCE_NUMBER \
  --starting-sequence-
     number=49548525860587679172233248436932853540505398606492073986 \
  --profile=ulp
{
    "ShardIterator":"AAAAAAAAAAE+WN9BdSD2AoDrKCJBjX7buEixAm6FdEkHHMTYl3MgrpsmU
UOp8Q0/yd0x5zPombuawVhr6t/14zsavYqpXo8PGlex6bkvvGhRYLVeP1BxUfP91JVJicfpKQP
3Drxf0dxYeTfw6izIMUN6QCvxEluR6Ca3t0INFzpvXDIm6y36EIGpxrYmxUD0fgXbHPRdL/s="
}
$ aws kinesis get-records --limit=1 --shard-iterator
     "AAAAAAAAAAE+WN9BdSD2AoDrKCJBjX7buEixAm6FdEkHHMTYl3MgrpsmUUOp8Q0/yd0x5zP
     om
BuawVhr6t/14zsavYqpXo8PGlex6bkvvGhRYLVeP1BxUfP91JVJicfpKQP3Drxf0dxYeTfw6iz
IMUN6QCvxEluR6Ca3t0INFzpvXDIm6y36EIGpxrYmxUD0fgXbHPRdL/s=" --profile=ulp
{
    "Records": [
        {
            "PartitionKey": "b5ed136d-c879-4f2e-a9ce-a43313ce13c6",
            "Data":"eyJvbiI6IHsic2VydmVyIjogeyJob3N0bmFtZSI6ICJ1bHAifX0sIC
JkaXJlY3Rfb2JqZWN0IjogeyJmaWxlc3lzdGVtX21ldHJpY3MiOiB7ImF2YWlsYWJsZSI6IDM3
MjY2OTY4NTc2LCAiZnJlZSI6IDM5MDQ0NTQyNDY0LCAic2l6ZSI6IDQyMjQxMTYzMjY0fX0sIC
J2ZXJiIjogInJlYWQiLCAiYXQiOiAiMjAxNS0wMy0xMFQyMjo1MTo1Ny4wNjY3MzUiLCAiaWQi
OiAiYjVlZDEzNmQtYzg3OS00ZjJlLWE5Y2UtYTQzMzEzY2UxM2M2IiwgInN1YmplY3QiOiB7Im
FnZW50IjogeyJ2ZXJzaW9uIjogIjAuMS4wIn19fQ==",
            "SequenceNumber":
     "49548525860587679172233248436932853540505398606492073986"
        }
    ],
    "NextShardIterator":"AAAAAAAAAAFqCzzLKNkxsGFGhqUlmMHTXq/Z/xsIDu6gP+LVd
4s+KZtiPSib0mqXRiNPSEyshvmdHrV4bEwYPvxNYKLIr3xCH4T3IeSS9hdGiQsLgjJQ1yTUTe+
0qg+UJSzba/xRB7AtQURMj0xZe3sCSEjas3pzhw48uDSLyQsZu5ewqcBLja50ykJkXHOmGnCXI
oxtYMs="
}
This is the same PartitionKey (our event ID), SequenceNumber, and indeed Base64-encoded data as before; we have successfully retrieved the same event twice!
No doubt, this section has been a lot to take in. Let’s summarize before we move on:
- The AWS CLI lets us read the events in a Kinesis stream.
- We require a shard iterator to read events from a single shard in the stream. Think of this as a temporary stream handle defining our cursor position in the stream.
- We use the shard iterator to read a batch of events from the shard.
- Along with the batch of events, we receive back the next shard iterator, which we use to read the next batch.
Figure 4.10 illustrates this process.
Figure 4.10. After we have retrieved our first shard iterator, each request for records returns a new shard iterator we can use for the next request.
;%22/%3E%3C/svg%3E)
Now that you understand the basics of reading events from a Kinesis stream, let’s return to the task at hand: monitoring our agent’s event stream in order to check whether our server is running low on disk space. After getting our hands dirty with the AWS CLI, we’re now going back to the AWS Python SDK, boto. The AWS CLI and boto expose the exact same primitives for stream processing, which is unsurprising, given that the AWS CLI is built on boto! The main difference is that the AWS Python SDK will let us use all the power of Python in our stream processing application.
The stream processing application we’ll build in this section is illustrated in figure 4.11. It follows a simple algorithm:
- Read each event from each shard of our events stream
- Check the event’s filesystem metrics to see whether our server’s disk is more than 80% full
- If the disk is more than 80% full, print out an alert to the console
Figure 4.11. Our monitoring application will read events from our Kinesis stream, check whether the reported disk usage has reached 80%, and raise an alert if so.
;%22/%3E%3C/svg%3E)
As before, we are going to build up our application piece by piece in the Python interpreter. This time, however, we’ll start with the stream reading mechanics and then work our way back to the business logic (the event monitoring).
First, we need to create a thread for each of the shards in our event stream. Although we know that our stream has two shards, this could change in the future, so we’ll use boto to check the number of shards our stream currently has. Type the following at your Python prompt:
mport boto3

session = boto3.Session(profile_name="ulp")
conn = session.client("kinesis", region_name="eu-west-1")

stream = conn.describe_stream(StreamName='events')
shards = stream['StreamDescription']['Shards']
print (f'Shard count: {len(shards)}')
Press Enter and you should see this:
Shard count: 2
This is all the information we need to create a thread for each shard:
from threading import Thread, current_thread

def ready(shard_id):
  name = current_thread().name
  print(f'{name} ready to process shard {shard_id}')

for shard_idx in range(len(shards)):
  thread = Thread(target = ready, args = (shards[shard_idx]['ShardId'], ))
  thread.start()
Press Enter again and you should see this:
Thread-1 ready to process shard shardId-000000000000
Thread-2 ready to process shard shardId-000000000001
Your threads’ numbers may be different. This is the basic pattern for the rest of our monitoring application: we will start a thread to process each shard, and each thread will run our monitoring code. One thing to note is that our application would have to be restarted if more shards were added (or indeed taken away), to create threads for the new shards. This is a limitation of working with Kinesis at such a low level. If we were using one of the Kinesis Client Libraries, changes in our stream’s population of shards would be handled for us transparently.
Now we need a loop in each thread to handle reading events from each shard via shard iterators. The loop will be broadly the same as that of figure 4.11:
- Get an initial shard iterator for the given shard
- Use the shard iterator to read a batch of events from the shard
- Use the returned next shard iterator to read the next batch of events
We’ll build this loop inside a Python class, imaginatively called ShardReader, which will run on its supplied thread. Type the following at the Python interpreter:
import time
from boto.kinesis.exceptions import ProvisionedThroughputExceededException

class ShardReader(Thread):
  def __init__(self, name, stream_name, shard_id):
    super(ShardReader, self).__init__(None, name)
    self.name = name
    self.stream_name = stream_name
    self.shard_id = shard_id
  def run(self):
    try:
      next_iterator = conn.get_shard_iterator(StreanName=self.stream_name,
        ShardId=self.shard_id,
     ShardIteratorType='TRIM_HORIZON')['ShardIterator']
      while True:
        response = conn.get_records(ShardIterator=next_iterator, Limit=10)
        for event in response['Records']:
          print(f"{self.name} read event {event['PartitionKey']}")
        next_iterator = response['NextShardIterator']
        time.sleep(5)
    except ProvisionedThroughputExceededException as ptee:
       print 'Caught: {}'.format(ptee.message)
       time.sleep(5)
We’ll kick off the threads in a way similar to before:
for shard in shards:
  shard_id = shard['ShardId']
  reader_name = f'Reader-{shard_id}'
  reader = ShardReader(reader_name, 'events', shard_id)
  reader.start()
Press Enter and, assuming that your agent from section 4.1 is still running in another console, you should see something like the following:
Reader-shardId-000000000000 read event 481d142d-60f1-4d68-9bd6-d69eec5ff6c0
Reader-shardId-000000000001 read event 3486558d-163d-4e42-8d6f-c0fb91a9e7ec
Reader-shardId-000000000001 read event c3cd28b8-9ddc-4505-a1ce-193514c28b57
Reader-shardId-000000000000 read event f055a8bb-290c-4258-90f0-9ad3a817b26b
There will be a burst of events to start with. This is because both threads are catching up with the historic contents of each shard—all events dating from the so-called TRIM_HORIZON onward. After the backlog is cleared, the output should settle down to an event every 10 seconds or so, matching the rate at which our agent is producing readings. Note the Reader-shardId- prefixes on each of the output messages: these tell us which ShardReader each event is being read by. The allocation is random because each event is partitioned based on its event ID, which as a UUID is essentially random.
Let’s see what happens if we stop the loop and then paste the same code in to start processing again:
Reader-shardId-000000000001 read event 3486558d-163d-4e42-8d6f-c0fb91a9e7ec
Reader-shardId-000000000000 read event 481d142d-60f1-4d68-9bd6-d69eec5ff6c0
Reader-shardId-000000000001 read event c3cd28b8-9ddc-4505-a1ce-193514c28b57
Reader-shardId-000000000000 read event f055a8bb-290c-4258-90f0-9ad3a817b26b
Compare the partition keys (remember, these are the event IDs) to the previous run, and you’ll see that processing has restarted from the beginning of the shard. Our processing app is a goldfish; it has no memory of what events it has read on previous runs. Again, this is something that higher-level frameworks like the Kinesis Client Library handle: they allow you to “checkpoint” your progress against a stream by using persistent storage such as Amazon’s DynamoDB.
Now that we have a stream processing framework in place, all that is left is to check the available disk space as reported in each event and detect if the available space drops below 20%. We need a function that takes a reading from our agent and generates an incident as required. Here is a function that does exactly that:
def detect_incident(event):
  decoded = json.loads(event)
  passed = None, None
  try:
    server = decoded['on']['server']['hostname']
    metrics = decoded['direct_object']['filesystem_metrics']
    pct_avail = metrics['available'] * 100 / metrics['size']
    return (server, pct_avail) if pct_avail <= 20 else passed
  except KeyError:
    return passed
Our function checks whether the proportion of available disk space is 20% or less, and if so, it returns the server’s hostname and the proportion of available disk space in a tuple. If the check passes, we return a None, indicating that there is no action to take. We also tolerate any KeyError by returning a None, in case other event types are added to this stream in the future.
Let’s test our new function in the Python interpreter with a valid event and an empty event:
detect_incident('{}')
(None, None)
detect_incident('{"on": {"server": {"hostname": "ulp"}},
 "direct_object": {"filesystem_metrics": {"available": 150, "free":
 100, "size": 1000}}, "verb": "read", "at": "2018-11-01T09:02:31.675773",
 "id": "b5ed136d-c879-4f2e-a9ce-a43313ce13c6", "subject": {"agent":
 {"version": "0.1.0"}}}')
(u'ulp', 15.0)
Good: the first call to detect_incident returned a (None, None) tuple, while the second call successfully detected that the server with hostname ulp has only 15% disk space available.
That’s all the code that we need for our monitoring application. In the following listing, we consolidate everything into a single file, monitor.py.
Listing 4.2. monitor.py
#!/usr/bin/env python

import json, time, boto3
from threading import Thread
from boto.kinesis.exceptions import ProvisionedThroughputExceededException

class ShardReader(Thread):
  def __init__(self, name, stream_name, shard_id):
    super(ShardReader, self).__init__(None, name)
    self.name = name
    self.stream_name = stream_name
    self.shard_id = shard_id

  @staticmethod
  def detect_incident(event):
    decoded = json.loads(event)
    passed = None, None
    try:
      server = decoded['on']['server']['hostname']
      metrics = decoded['direct_object']['filesystem_metrics']
      pct_avail = metrics['available'] * 100 / metrics['size']
      return (server, pct_avail) if pct_avail <= 20 else passed
    except KeyError:
      return passed

  def run(self):
    try:
      next_iterator = conn.get_shard_iterator(StreamName=self.stream_name,
        ShardId=self.shard_id,
     ShardIteratorType='TRIM_HORIZON')['ShardIterator']
      while True:
        response = conn.get_records(ShardIterator=next_iterator, Limit=10)
        for event in response['Records']:
          print(f"{self.name} read event {event['PartitionKey']}")
          s, a = self.detect_incident(event['Data'])               #1
          if a:
            print(f'{s} has only {a}% disk available!')            #2
        next_iterator = response['NextShardIterator']
        time.sleep(5)
    except ProvisionedThroughputExceededException as ptee:
       print(f'Caught: {ptee.message}')
       time.sleep(5)

if __name__ == '__main__':
  session = boto3.Session(profile_name="ulp")
  conn = session.client("kinesis", region_name="eu-west-1")
  stream = conn.describe_stream(StreamName='events')
  shards = stream['StreamDescription']['Shards']

  threads = []                                                     #3
  for shard in shards:
    shard_id = shard['ShardId']
    reader_name = f'Reader-{shard_id}'
    reader = ShardReader(reader_name, 'events', shard_id)
    reader.start()
    threads.append(reader)                                         #3

  for thread in threads:                                           #4
    thread.join()
Make the monitor.py file executable and run it:
chmod +x monitor.py
./monitor.py
Reader-shardId-000000000001 read event 3486558d-163d-4e42-8d6f-c0fb91a9e7ec
Reader-shardId-000000000000 read event 481d142d-60f1-4d68-9bd6-d69eec5ff6c0
Reader-shardId-000000000001 read event c3cd28b8-9ddc-4505-a1ce-193514c28b57
Reader-shardId-000000000000 read event f055a8bb-290c-4258-90f0-9ad3a817b26b
...
Our monitoring application is now running, reading each event in both shards of our events stream and reporting back on our server’s disk usage. Unless you have a disk drive that’s as cluttered as mine, chances are that the disk usage alert isn’t firing. We can change that by temporarily creating an arbitrarily large file on our hard drive, using the fallocate command.
A quick filesystem check in my Vagrant virtual machine suggests that I have around 35 gigabytes available:
$ df -h
Filesystem      Size  Used Avail Use% Mounted on
/dev/sda1        40G    5G 34.8G  12% /
I created a temporary file sized at 30 gigabytes:
$ fallocate -l 30G /tmp/ulp.filler
$ df -h
Filesystem      Size  Used Avail Use% Mounted on
/dev/sda1        40G   35G  4.8G  88% /
And then I switch back to the terminal running monitor.py and see this:
Reader-shardId-000000000000 read event 097370ea-23bd-4225-ae39-fd227216e7d4
Reader-shardId-000000000001 read event e00ecc7b-1950-4e1a-98cf-49ac5c0f74b5
ulp has only 11% disk available!
Reader-shardId-000000000000 read event 8dcfe5ba-e14b-4e60-8547-393c20b2990a
ulp has only 11% disk available!
Great—the alert is firing! Every new filesystem metrics event being emitted by our agent.py is now triggering an alert in monitor.py. We can switch this off just as easily:
$ rm /tmp/ulp.filler
And switch back to our other terminal:
Reader-shardId-000000000001 read event 4afa8f27-3b62-4e23-b0a1-14af2ff1bfe1
ulp has only 11% disk available!
Reader-shardId-000000000000 read event 49b13b61-120d-44c5-8c53-ef5d91cb8795
Reader-shardId-000000000000 read event 8a3bf478-d211-49ab-8504-a0adae5a6a50
Reader-shardId-000000000000 read event 9d9a9b02-dea3-4ba1-adc9-464f4f2b0b31
So, this completes our systems monitoring example. To avoid incurring further AWS costs, you must now delete the events stream from the Kinesis screen in your AWS UI, as in figure 4.12.
;%22/%3E%3C/svg%3E)
To recap: we have written a simple systems monitoring agent in Python that emits a steady stream of filesystem metrics onto an Amazon Kinesis stream. We have then written another Python application, again using boto, the Amazon Python SDK, which monitors the agent’s event stream in Kinesis, looking for hard drives filling up. Although our systems monitoring example is a rather narrow one, hopefully you can see how this could be extended to a more generalized monitoring approach.
Working with a two-shard Kinesis stream at a low level by using the AWS CLI and boto has given you a good handle on how Kinesis is designed. In the coming chapters, we will work with higher-level tools such as the KCL and Apache Spark Streaming, and your understanding of how Kinesis is designed at this lower level will stand us in good stead for this.
- Amazon Kinesis is a fully managed unified log service, available as part of the Amazon Web Services offering.
- Amazon Kinesis and Apache Kafka have differences in terminology, but the semantics of both technologies are extremely similar.
- A wide array of stream processing frameworks already support Amazon Kinesis, including Apache Spark Streaming, Apache Storm, and Amazon’s own Kinesis Client Libraries (KCLs) for Java and Python.
- We can set up an identity and access management (IAM) user in AWS, and assign a managed policy to that user to give full permissions on Kinesis.
- Using the AWS CLI, we can start writing events to a Kinesis stream, and read those same events out by using an abstraction called a shard iterator.
- Systems monitoring is a new use case for unified log processing. We can model systems monitoring events by using our standard grammatical approach, and create agents that run on servers and push monitoring events into our unified log.
- We can build a simple systems monitoring agent in Python by using the Python SDK for AWS, called boto. This agent runs in an infinite loop, regularly emitting events that consist of readings of filesystem statistics from the local server.
- We can build a low-level monitoring application in Python by using Python threads and boto. Each thread reads all events from a single Kinesis shard by using shard iterators, monitors the reported disk usage, and raises an incident if disk usage reaches 80%.
- Higher-level tools such as the KCL will handle the basics of Kinesis stream processing for us, including distribution of work across multiple servers and checkpointing in a database our progress against each shard.