An annotated dataset is the output of a D3 layout function. Rather than drawing a chart itself, a layout preprocesses input data into a new structure containing the values needed to position and draw a chosen visualization. The output retains links to the original input data while adding layout-specific measurements. section 5.0 section 5.4
Treat the annotated dataset as the bridge between data preparation and SVG drawing. First format the input, configure a layout generator, then call that generator. Bind its result to chart elements or pass it to a shape generator; the added attributes determine where those elements appear. section 5.1.2 section 5.2
The annotations depend on the layout that produced them:
- A pie layout returns one object per slice, including the original datum, slice value, index, startAngle, endAngle, and padAngle. An arc generator can use the two angles to calculate an SVG path. section 5.1.2 section 5.4
- A stack layout returns a multidimensional structure: one array per series, containing one lower-and-upper-boundary pair per input row. Series IDs are available through key, and each pair retains its original row as d.data. section 5.2.1 section 5.4
From music sales to stacked bars
Configure d3.stack() with music-format keys and call it with yearly sales data. For each series, bind its boundary pairs to rectangles: use d.data.year for x, d[1] for y, and the difference between scaled d[0] and d[1] for height. The same annotated dataset can instead feed d3.area() to draw stacked paths for a streamgraph. section 5.2.1 section 5.2.2 section 5.2.3
Figure 5.13 Annotated dataset returned by the stack layout generator
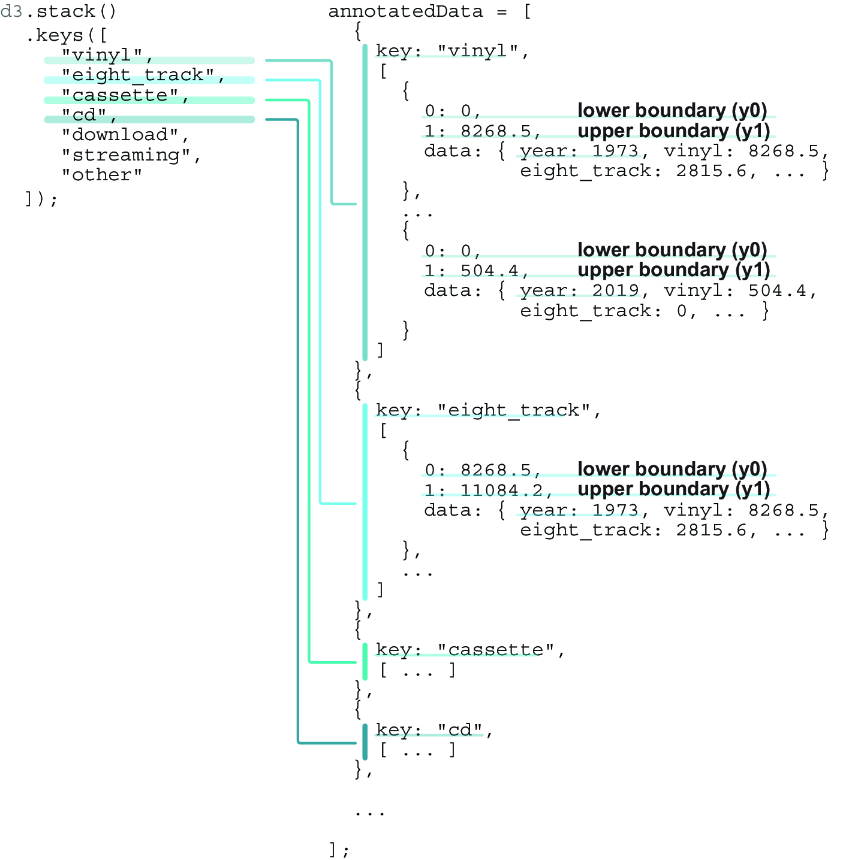
Inspect the stacked output structure to see how series arrays, boundary pairs, and original data are organized before binding them to SVG elements. section 5.2.1
Do not confuse a layout with a shape generator. The layout computes chart-ready values; drawing happens later. Pie annotations supply angular boundaries for arcs, while stack annotations supply vertical boundaries for rectangles or areas. section 5.0 section 5.2.3
