Apache Superset is an open-source BI and visualization layer that turns SQL-accessible lakehouse data into interactive charts and dashboards. In an Iceberg architecture, it consumes curated data through a query engine such as Dremio rather than owning storage or ingestion. section 3.5.1 section 3.6
A local deployment connects Superset to the surrounding analytics stack:
- Run Superset alongside PostgreSQL, MinIO, Apache Spark, Project Nessie, and Dremio with Docker Compose. section 3.2 section 3.2.2
- Initialize Superset, open its local web interface, and sign in with the configured administrator account. section 3.2.4 section 3.5.1
- Add Dremio as a database connection using its Arrow Flight URI; enable encryption for production deployments. section 3.5.2
- Create datasets from queried Iceberg tables, then build, arrange, and publish charts within dashboards. section 3.5 section 3.5.4
Sales analytics dashboard
Use the fashion_sales dataset to create a line chart plotting SUM(sales_amount) by sales_date and a pie chart aggregating SUM(sales_amount) by category. Save them as Sales by Day and Sales by Category, place both on a Sales Analytics dashboard, and publish it. section 3.5.4
Figure 3.2 Components of Apache Iceberg, a data lakehouse built using the Apache Iceberg table format
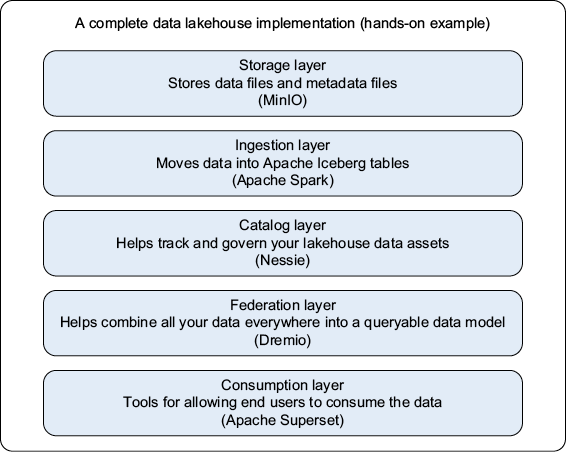
Use the architecture diagram to trace Superset’s position as the consumption layer above Dremio, Iceberg storage, catalog, processing, and operational services. section 3.2