A beta distribution describes which underlying success rates are most likely after observing successes and failures. With 7 successes and 3 failures, alpha = 7 and beta = 3. section 3.8
Unlike the binomial distribution, which models a count of successes, the beta distribution models the continuous range of possible success rates from 0 to 1. Its smooth curve shows probability density, not probability directly; the total area under the curve is 1. section 3.12 section 3.8
Estimating a success rate
Suppose a manufacturer records 7 successes and 3 failures. Use SciPy to draw the beta density and calculate the area between success rates of 0.4 and 0.7: from scipy.stats import beta a, b = 7, 3 area = beta.cdf(0.7, a, b) - beta.cdf(0.4, a, b) print(area) # 0.437796414 The result is the area under the curve between 0.4 and 0.7, providing a way to examine how plausible that range of underlying success rates is given the observations. section 3.8
Figure 3.6 The beta distribution showing probabilities of success rates for a single trial
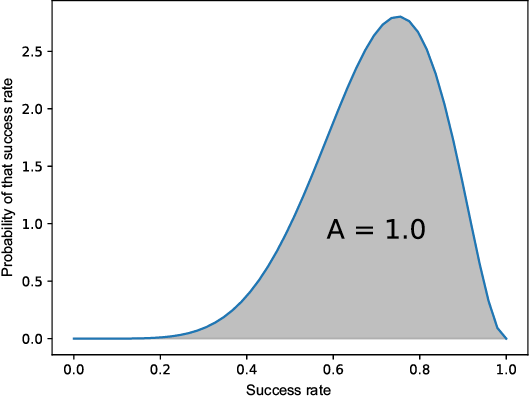
View the smooth beta-distribution curve for the possible success rates. section 3.8
