The classical picture links model capacity to predictive error: training error falls as models grow, while test error forms a U-shaped curve. Polynomial fitting makes the tradeoff concrete: a line underfits parabolic data, a quadratic fits it, and higher-degree polynomials can chase noise. section 8.5.2
That picture shaped early deep-learning practice. AlexNet’s 60 million parameters raised overfitting concerns, addressed with data augmentation, dropout, and weight decay. Yet larger deep models later generalized well even with modest or no explicit regularization, challenging the idea that they simply sat on the overfitting side of the U. section 8.5.2
Figure 8.9 Left: the classical bias–variance tradeoff. Training error (called “risk” in this image) is shown as a dashed line. It falls monotonically, whereas the test error (solid line) is U-shaped, with the bottom being optimal. Right: beyond the interpolation threshold, test error peaks and then declines again in the overparameterized (interpolating) regime, while training risk remains near zero. Used with permission granted by the lead author (Mikhail Belkin).
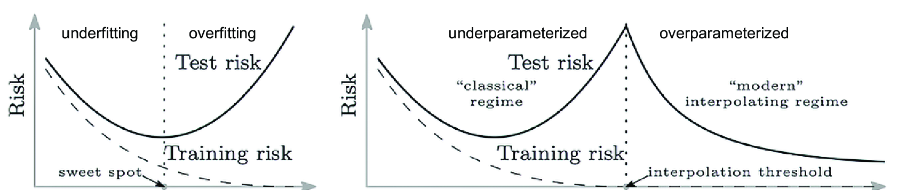
Compare the classical U-shaped test-error curve with the later decline beyond the interpolation threshold. section 8.5.2
In overparameterized models, capacity exceeds what is needed to fit the training data exactly; the interpolation threshold marks where exact fitting becomes possible. Beyond it, test error can rise near the threshold and then fall again—a pattern named double descent by Mikhail Belkin and colleagues in 2018. section 8.5.2 section 8.5.3
A model barely large enough to fit the data may have a brittle solution, highly sensitive to noise or misspecified labels. Larger models have many interpolating solutions; stochastic gradient descent can find one that fits the data while still generalizing. More capacity, then, need not mean a more complex explanation. section 8.5.3
Figure 8.10 Test (solid line) and training (dashed line) errors for ResNet as the width increases. A peak near the interpolation threshold (dashed line; shaded “critical” band) illustrates double descent, in which error rises as the model fits the data, then falls again for larger widths. Used with permission granted by the lead author (Preetum Nakkiran).
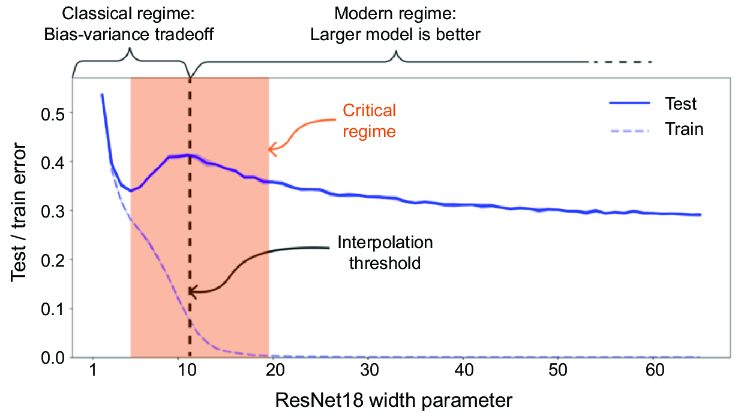
The ResNet plot shows error peaking near the interpolation threshold before declining as width increases. section 8.5.3


