A bubble map places circles at geographic coordinates and uses their size to encode a quantitative value. It turns location into the stage and magnitude into the spotlight. section 6.3.1
Use bubble maps when the geography matters but filled regions would exaggerate land area. They work especially well for point locations, election results, rentals, and other data tied to latitude and longitude. section 2.1.3 section 6.3.1
Design the map so its visual signals carry their share of the load:
- Size bubbles by a meaningful measure, such as a station’s percentage of commute-hour rides or a county’s vote margin. section 2.1.3 section 6.3.1
- Add color carefully, and do not make color the only way to distinguish categories; shapes can provide a second, more accessible cue. section 6.3.1
- Check for overlap and crowding, especially when many locations are close together or bubbles are very small. section 6.3.1
London commute-hour rentals
Filter rides to morning and evening commute hours, then place bubbles at starting and ending stations. Comparing four map panels reveals larger morning destinations in Central London and more evenly distributed evening endpoints. section 2.1.3
Figure 2.5 Maps of London showing morning rentals in the first row and evening rentals in the second row. In the columns, we have the locations of the starting and ending rental stations on the left and right, respectively. Thus, the starting locations for morning rentals are in the upper left, the ending stations for the evening rentals are in the lower right. The other two permutations are at their respective locations in between. (Base map © Mapbox © OpenStreetMap. See https://www.mapbox.com/about/maps/ and https://www.openstreetmap.org/copyright.)
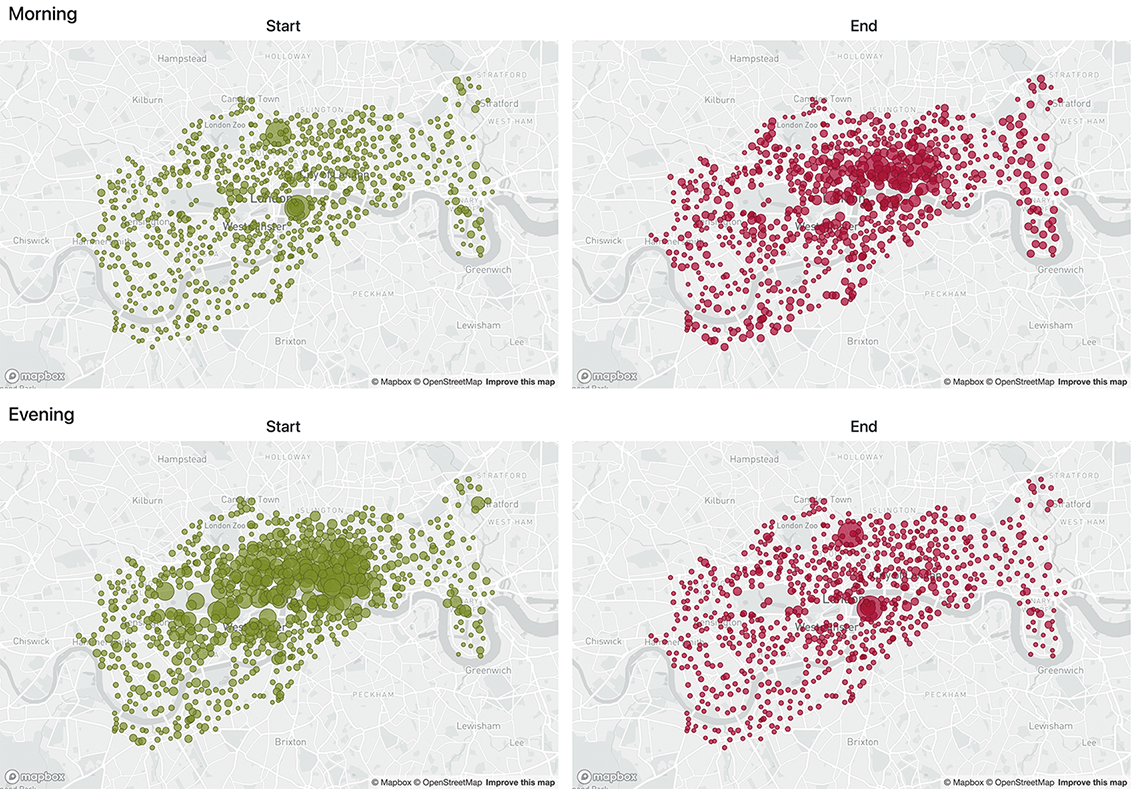
Compare bubble positions and sizes across morning versus evening rides and starting versus ending stations. section 2.1.3
