A candlestick body spans an asset’s opening and closing prices. Its height shows the price difference, while its color indicates direction: green or white signals a higher close, and red or black signals a lower close. section 10.2.1 section 10.4
Use the body to read the period’s movement and approximate volatility:
- A long body indicates a larger opening-to-closing move and commonly signals higher volatility. section 10.2.1
- A short body indicates little net movement; repeated short bodies can suggest a calmer market. section 10.2.1
- Read the body with the upper and lower wicks, which mark the period’s highest and lowest prices. section 10.2.1
Reading a trading day
If a share opens near $138, reaches about $140, falls slightly above $134, and closes just below $136, its bearish body spans the opening and closing prices while the wicks capture the intraday extremes. section 10.2.1
Figure 10.19 The anatomy of a bullish (white) and bearish (black) candlestick
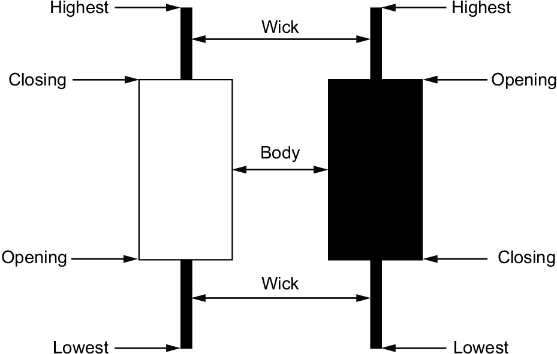
Compare bullish and bearish bodies with their associated wicks in a labeled anatomy diagram. section 10.2.1
