A candlestick chart summarizes an asset’s open, high, low, and close prices for each interval. The body compares opening and closing prices; the upper and lower wicks show the period’s extremes. section 10.2.1
Read each candle by checking:
- Green or white bodies indicate a higher close than open; red or black bodies indicate a lower close. section 10.2.1
- Long bodies suggest greater volatility, while multiple short bodies suggest calmer price movement. section 10.2.1
- Patterns such as Doji, Hammer, and Engulfing provide labels for recurring price behavior, not guaranteed outcomes. section 10.2.1
Create one with Python
Retrieve NVIDIA history with yfinance, convert it to a DataFrame, remove missing values, and call mplfinance with type='candle'. section 10.2.1
Figure 10.18 This candlestick diagram references three trading days of NVIDIA, from which we deduce price movements. Days 1 and 3 ended with a lower closing price than the opening price, and we can also see that on Day 3, the price was more volatile than on the preceding days.
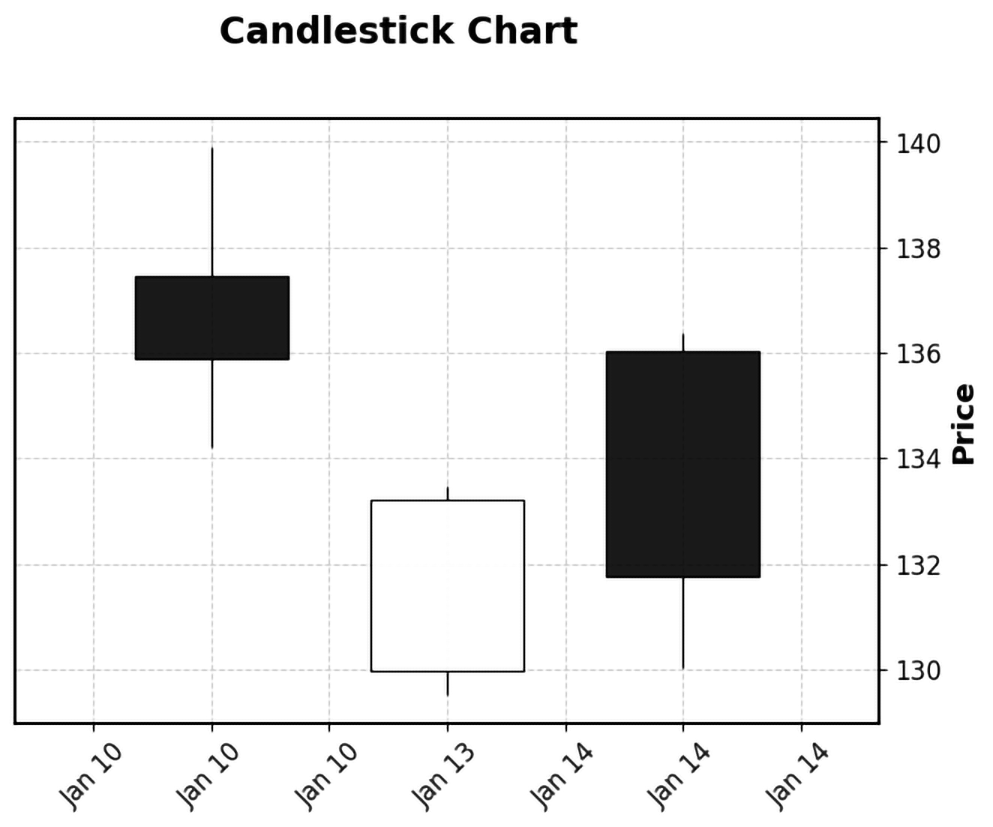
Compare three NVIDIA trading days to see bullish or bearish closes and differences in daily volatility. section 10.2.1
