liveBook · Manning

Candlestick wick

As explained in Investing for Programmers

A candlestick wick is the line extending from a candle’s body to the highest or lowest price reached during the interval.

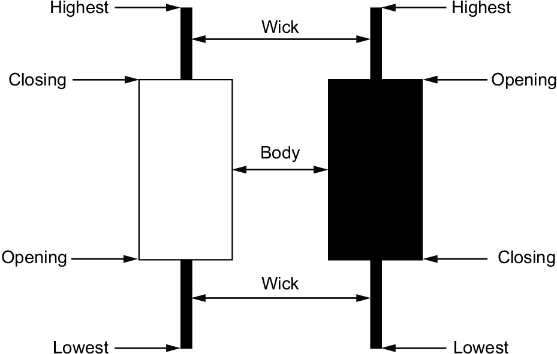
A candlestick wick, or shadow, extends from the candle’s body to the highest or lowest price reached during the trading period. The upper wick reaches the high; the lower wick reaches the low. section 10.2.1

Wicks preserve intraperiod price movement that the opening and closing prices alone omit. Long wicks can indicate rejection of price levels, while body size helps distinguish momentum from indecision. section 10.2.1 section 10.4

Reading one trading day

A share opening near $138 can rally to $140, fall slightly above $134, and close just below $136. The candle’s wicks record the intraday high and low around its body. section 10.2.1

Figure 10.19 The anatomy of a bullish (white) and bearish (black) candlestick
figure

Use the candlestick anatomy diagram to compare upper and lower wicks with bullish and bearish candle bodies. section 10.2.1

How Investing for Programmers covers it

How deep it goes
Defines upper and lower wick anatomy and links long wicks to rejection, without developing quantitative pattern rules.
Examples
Uses NVIDIA price movement, an anatomy diagram, and Python candlestick charts as concrete examples.
What you can do after
Evaluate/understand intraday highs, lows, rejection, and volatility from candlestick charts.
How it connects
Connects candlestick wicks with candlestick bodies, opening price, closing price, support, and candlestick patterns.

Related concepts

This explainer was generated by Manning's knowledge graph from the text of Investing for Programmers. The section links point to the parts of the book it draws on.