A chart pattern is a recurring configuration of asset-price movements that traders interpret as potentially predictive of what happens next. Technical analysis searches for these configurations in price development, while recognizing that patterns are templates drawn from the past rather than guarantees. section 10.1 section 10.4
Classify chart patterns by what they do to the prevailing trend:
- Reversal patterns follow a trend and then reverse it. A bearish double top begins with an uptrend, forms two peaks, and proceeds into a downtrend. section 10.1.2 section 10.4
- Continuation patterns interrupt a trend with an opposite movement before the original direction resumes; bullish and bearish flags illustrate this structure. section 10.1.2
- Common named forms include head-and-shoulders, rising wedge, expanding triangle, triple top, pennant, and candlestick patterns such as Doji, Hammer, and Engulfing. section 10.1.2 section 10.4
Bearish double top
An asset rises as traders expect further gains, reaches Top 1, declines, attracts renewed buying, and rises toward a second peak. After the second reversal, the decline continues. Traders interpreting the formation may use it as a bearish signal, but identification remains difficult because the shape reflects prior price behavior. section 10.1.2
Figure 10.12 The bullish and bearish flag patterns are reference examples for continuation patterns. A temporary initial trend was reversed and continues again in the same direction.
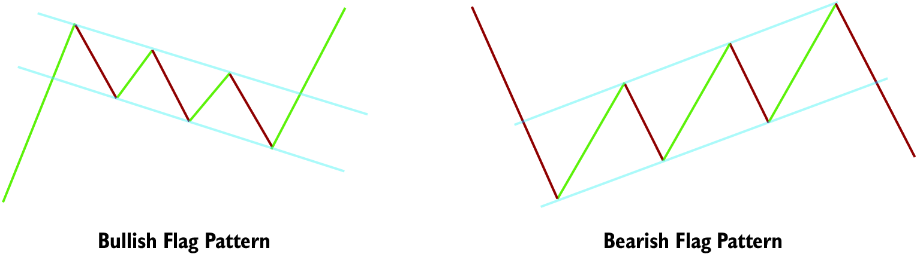
Compare bullish and bearish flag formations to see how a temporary countertrend movement can precede continuation. section 10.1.2
