Technical analysis evaluates trading activity—especially price changes and volume—to identify historical patterns and forecast potential future price movements. Charts turn numerical history into a visual basis for interpreting trends, momentum, and timing rather than company value alone. section 1.3.1 section 10.0
A practical technical-analysis workflow includes:
- Collect historical open, high, low, close, and volume data using structured financial-data libraries or web scraping. section 1.3.1 section 3.4.2
- Visualize price development with line charts or candlestick charts to inspect daily movements across a chosen time horizon. section 1.3.1 section 10.0
- Calculate returns and summarize them with mean, standard deviation, and variance to compare performance and fluctuation. section 3.4.2
- Inspect indicators and recurring signals such as moving-average crossovers, while matching the interpretation to the trader’s time horizon. section 10.1.3
Comparing historical price behavior
Download 2023 prices for Apple, Coca-Cola, and NuScale with yfinance, plot normalized closing prices, calculate simple or logarithmic returns, and aggregate mean, standard deviation, and variance. The resulting comparison shows materially different performance and fluctuation across the three stocks. section 3.4.2
Figure 1.2 The price development of NVIDIA from 2016 to 2025. Notice the sharp rise in recent years; this is a typical example of the growth that attracts many traders and investors. Keep in mind that such growth rates are rare.
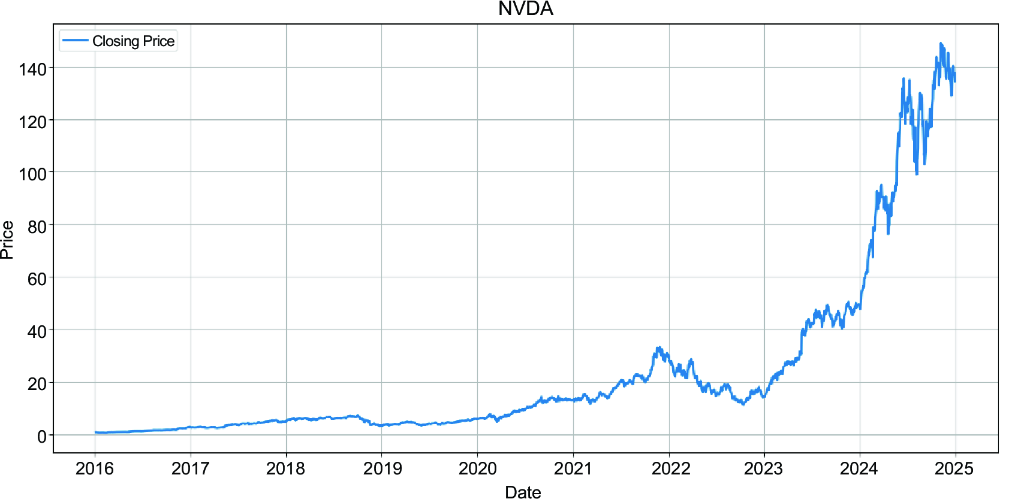
Use the long-term NVIDIA price chart to practice distinguishing a visible historical trend from a reliable forecast; exceptional growth should not be treated as typical. section 1.3.1
Technical analysis remains contested: some investors regard its effectiveness as unproven, while others use patterns and signals operationally. A chart can support decisions, but it cannot guarantee an outcome; volatility, leverage, market events, and the selected time horizon change the risk. section 10.1.3 section 10.1
